
The short version
- Share of voice in influencer marketing is the share of the category conversation your brand owns, measured against a fixed set of competitors over the same period.
- Track 4 shares: engagement, content volume, reach and creator partnerships. Creator partnership share moves first, so watch it closest.
- Calculate it monthly. One snapshot shows where you stand. 3 months of it shows which way you are moving.
The campaign numbers look good. Engagement rate is up. Reach held. Then the CMO asks one question: are we gaining ground on our 3 main competitors, or losing it?
Nobody in the room has an answer. The report shows what the campaign produced in absolute terms. It does not show whether the category moved in the brand’s favour while the campaign ran, or moved away from it.
That is the gap between measuring campaign performance and measuring market position. Engagement rate answers the first. Share of voice answers the second. For an influencer program that is supposed to build category authority over time, only the second tells you whether it is working.

What share of voice means in influencer marketing

In paid media, share of voice is based on ad spend or impression share against other brands in the category. Influencer marketing does not work that way. You rarely know what competitors spend on creators, and impressions are not reported consistently across platforms. So share of voice in influencer marketing is better read as the share of the category conversation your brand owns across social media and creator content.
There are 4 ways to measure that share.
Engagement share
Add up the likes, comments, shares and saves your brand earned from creator and organic content in the period. Compare it with the combined engagement of every brand in your competitive set over the same period. If your brand earned 30% of the total, your engagement share of voice is 30%.
Content volume share
Count the content created about your brand: creator posts, branded hashtag posts and organic mentions. Compare it with the total created about the competing brands.
Audience reach share
How many people your creator campaigns reached, compared with the total audience reached by the competitive set in the same window.
Creator partnership share
How many of the creators actively working in your category are working with you, compared with each competitor. This is the most overlooked of the 4 and the one that predicts the others.
Why share of voice beats absolute engagement as a strategy metric
Absolute engagement improves when your campaigns improve. Share of voice improves when you improve faster than the category around you. Those are different things, and confusing them points strategy the wrong way.
Say your influencer campaign engagement rose 20% over the last 2 quarters. That sounds like progress. If your competitors rose 40% over the same 2 quarters, your campaign improved and your position went backwards. Engagement alone would never have shown you that.
Two situations make the distinction matter in practice.
A competitor launches a new creator program. If a rival enters the category’s creator pool with a meaningful number of new partnerships, your share of voice can fall while your own campaign metrics stay flat. Tracking share of voice catches it early. Tracking only your own numbers never catches it.
A new product or category enters the market. New entrants often gain share of voice quickly because they are entering a growing space. If the category is expanding, your own growth has to be read against that expansion, not against last quarter.
How to calculate share of voice for influencer campaigns
The calculation runs in 4 steps.
Step 1: define the competitive set
Pick 3 to 10 brands competing for the same audience, not every brand loosely adjacent to the category. A Tier 2 D2C skincare brand is not competing with a national FMCG house for the same creators or the same buyers. The competitor analysis guide covers how to split the set into direct, aspirational and emerging competitors.
Step 2: collect the data over the same window
Engagement, content volume, reach and creator partnerships for every brand in the set, over the same period. Mismatched windows are the most common reason share of voice numbers get challenged in a review.
Step 3: calculate each brand’s share
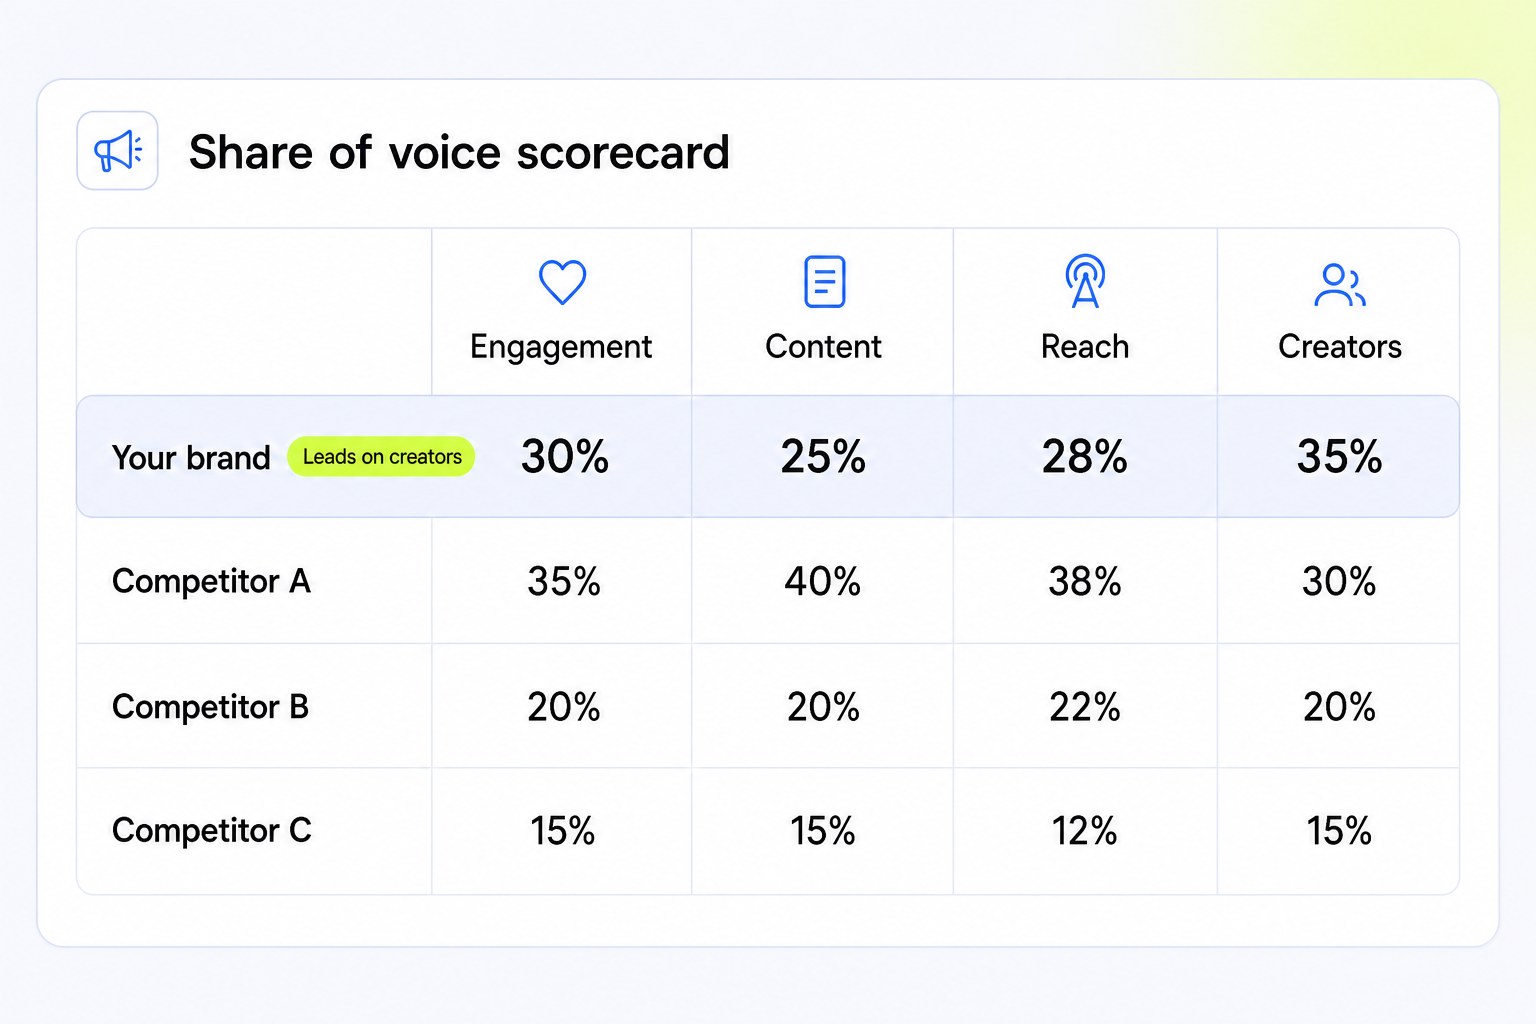
Divide each brand’s figure by the combined total for the whole set. Do this per metric. Here is a worked example for a 4-brand set.
| Brand | Engagement share | Content volume share | Reach share | Creator partnership share |
|---|---|---|---|---|
| Your brand | 30% | 25% | 28% | 35% |
| Competitor A | 35% | 40% | 38% | 30% |
| Competitor B | 20% | 20% | 22% | 20% |
| Competitor C | 15% | 15% | 12% | 15% |
In this example the brand is second on engagement and reach but first on creator partnerships. That usually means engagement and content share will climb over the next 2 months, as those partnerships produce content.
Step 4: track direction over consecutive periods
One snapshot shows the position. Several months of the same calculation show momentum, and momentum is what a strategy decision needs.
The Listening Suite handles steps 2 and 3 for you. Its competitor analysis view stacks your brand against the competitors you choose on followers, engagement rate, Social Score and average views, with the trend built in and updated continuously rather than pulled by hand each month.
Creator partnership share is the early warning
If a brand works with more of the active creators in its category, it publishes more content and earns more engagement over the following weeks. If that share starts falling, content volume and engagement usually follow a month or two later.
That lag is what makes creator partnership share useful. A competitor signing 15 new creators this month shows up in engagement share next month. Watch the partnership share and you see the move before the results are obvious.
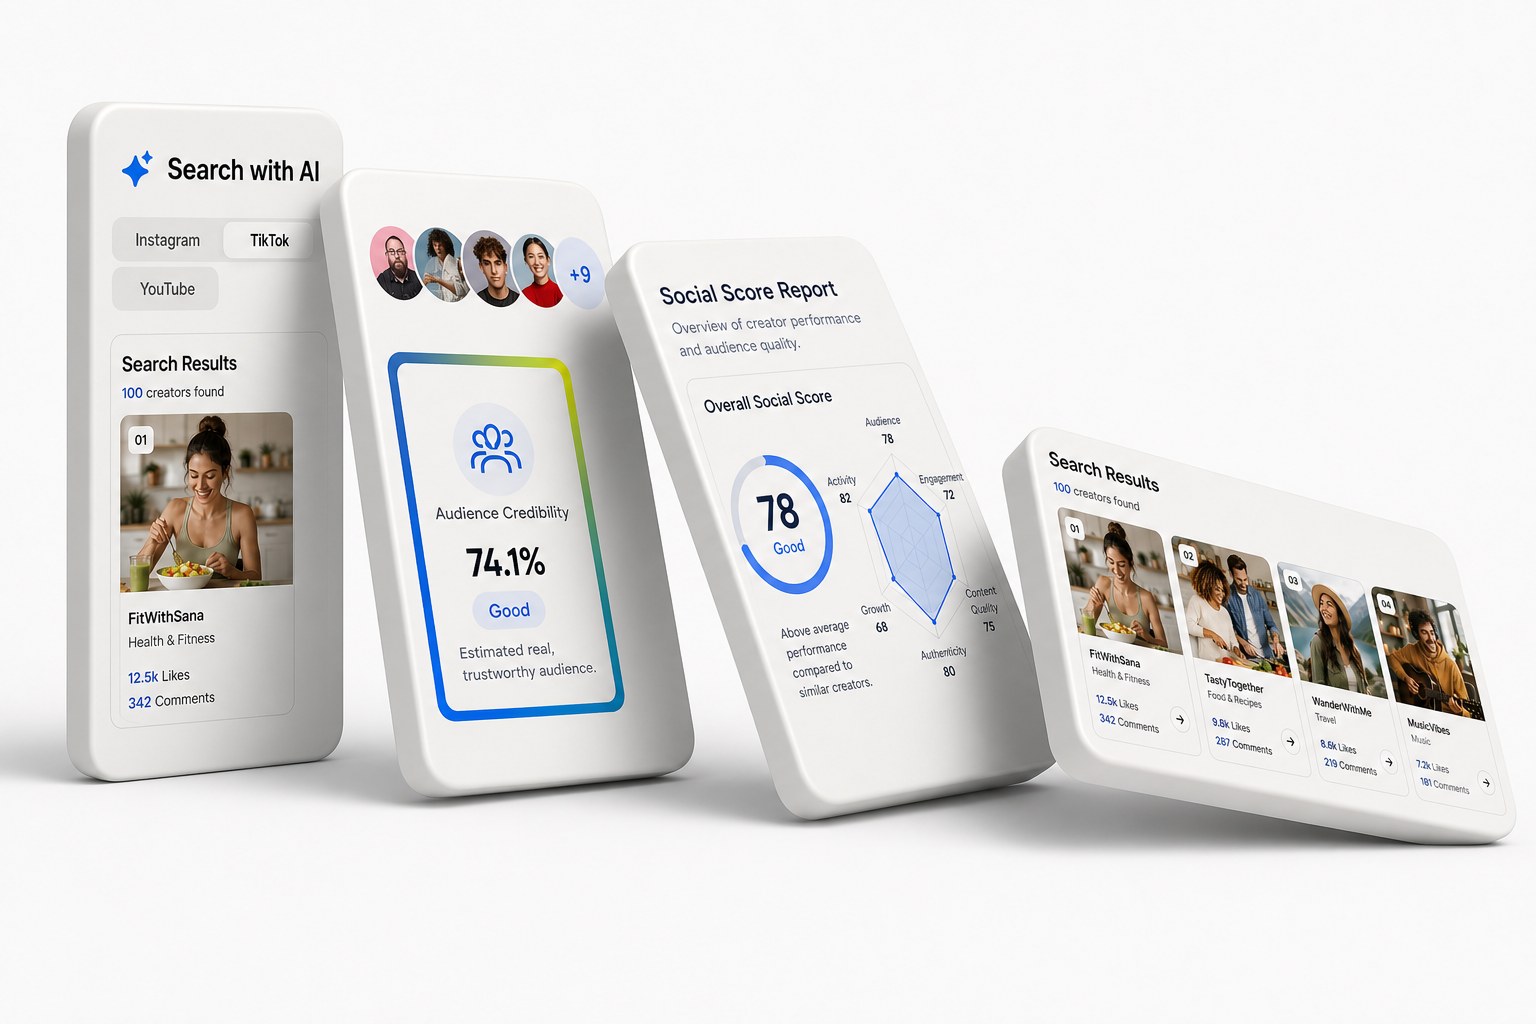
The influencer map in the Listening Suite shows which creators each brand in your category has partnered with recently, so you can see how the creator pool is distributed and whether your slice is growing or shrinking. Soch Apparels used that kind of creator-level view to find the right regional creators in Delhi, Mumbai, Kolkata and Bengaluru, and lifted regional engagement 45%. The Soch Apparels case study has the detail.
How often to measure share of voice, and what to do with it
Monthly. A monthly calculation across engagement, content volume, reach and creator partnerships gives you a trend worth acting on after about 3 data points. Quarterly is too slow to catch a category shift in time to respond.
When share of voice falls for 2 consecutive months, find out what changed. Have competitors expanded their creator partnerships? Have they moved to a format that is performing better? Do your creator briefs need updating to match what the audience is responding to now?
When share of voice is growing, work out which share is driving it. Growth from engagement share alone is fragile. It can come from one viral post. Growth from engagement share and creator partnership share together is far more durable, and worth protecting.
What a share of voice dashboard needs
A share of voice setup only earns its keep if it includes 4 things.
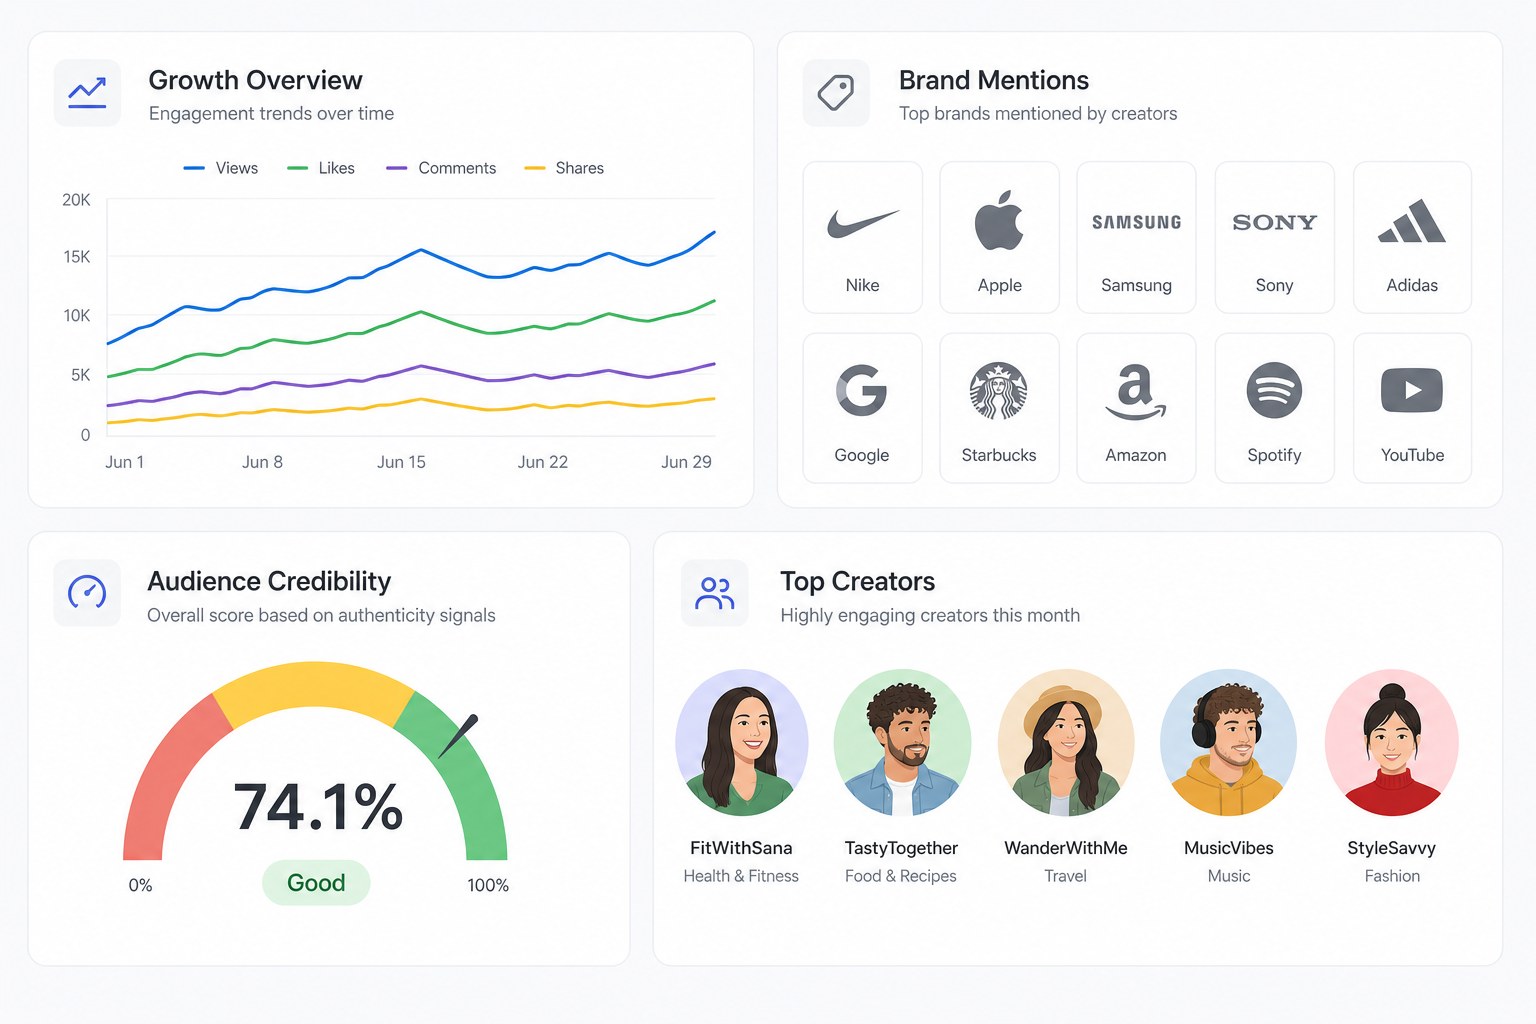
- Competitive engagement rate, not only your own. Your engagement rate in the same view as your 3 to 10 defined competitors, never reviewed in isolation.
- A trend line, not a single snapshot. Direction is what allows a strategic response. A snapshot shows where you stand today. A trend shows whether you are moving.
- Creator partnership visibility per competitor. Which creators each competitor is working with, refreshed often enough to catch new partnerships before they have produced a wave of content.
- Social Score alongside engagement rate. Engagement rate can spike off one viral post. A composite credibility score smooths that out and gives a steadier basis for comparison. It only means something when run against your actual competitors, not a generic benchmark.
Share of voice tells you whether the category is moving in your favour. It does not tell you what the attention was worth in rupees. For that, read it alongside earned media value, and use the broader social media market research methods to understand why the category moved.
Brands that track only their own campaign metrics know how they are doing. Brands that track share of voice know whether the category is moving their way. For an influencer program meant to compound into category authority, share of voice is the metric that tells you whether the compounding is happening.
See CultureX in action
Compare your share of voice against the competitors you choose, with creator partnerships and the trend in one view.
Frequently asked questions
What is share of voice in marketing?
Share of voice shows how visible your brand is compared with other brands in the same category. In influencer marketing it compares your engagement, published content, reach and creator partnerships against competitors, rather than looking at your own campaign results alone.
How is share of voice calculated for influencer marketing?
Choose 3 to 10 direct competitors. Collect the same data for each brand over the same period: engagement, content volume, reach and creator partnerships. Add up the totals per metric and work out each brand’s share. Repeat monthly to see whether your position is improving or slipping.
What is the difference between share of voice and engagement rate?
Engagement rate tells you how well your own content performed. Share of voice tells you how visible you are compared with competitors. Your engagement rate can improve while your share of voice drops, if other brands in the category grow faster.
How often should a brand measure share of voice?
Monthly. That is frequent enough to spot a competitor signing new creators or a shift in content formats before it costs you a quarter. Quarterly reviews leave you reacting months after the move.
What is creator partnership share and why does it matter?
It is the share of a category’s actively working creators that your brand is partnered with, relative to competitors. It matters because it leads the other metrics: changes in partnerships show up in content volume and engagement share a month or two later.