
The short version
- Earned media value (EMV) puts a rupee figure on the engagement your influencer content earned: total engagements multiplied by a cost-per-engagement benchmark.
- EMV measures scale, not sales. On its own it flatters every campaign. Read it next to CPE, sentiment and conversions.
- The benchmark decides the number. Use your own paid-media CPE for that platform, not an industry average.
A campaign costs Rs 6 lakh and the report says it delivered Rs 48 lakh in earned media value. It goes on the first slide. Then someone in the room asks what Rs 48 lakh means in sales, and nobody has an answer.
Earned media value is one of the most quoted numbers in influencer marketing and one of the least understood. Teams treat it as proof that a campaign worked. What it measures is narrower: what the engagement your content earned would have cost if you had bought the same attention through paid ads. That is a useful reference point. It is not the whole story.

What earned media value means
Earned media value is a monetary estimate of the engagement that influencer or unpaid content generates. You take the engagements a piece of content earned, apply a benchmark cost per engagement, and get a rupee figure. It answers one question: if you had to buy this same attention through paid advertising, what would it cost?
The word “earned” comes from an old media planning split. Paid media is advertising you buy. Owned media is your own channels. Earned media is everything other people, including creators, customers and press, generate about you without you paying for the placement.
Influencer content sits in an awkward spot. You pay the creator a fee, but the engagement the post picks up reaches people you did not pay to reach directly. EMV tries to put a number on that extra reach. If you are new to the metric stack, the influencer marketing glossary covers EMV, CPE and CPV side by side.
The earned media value formula
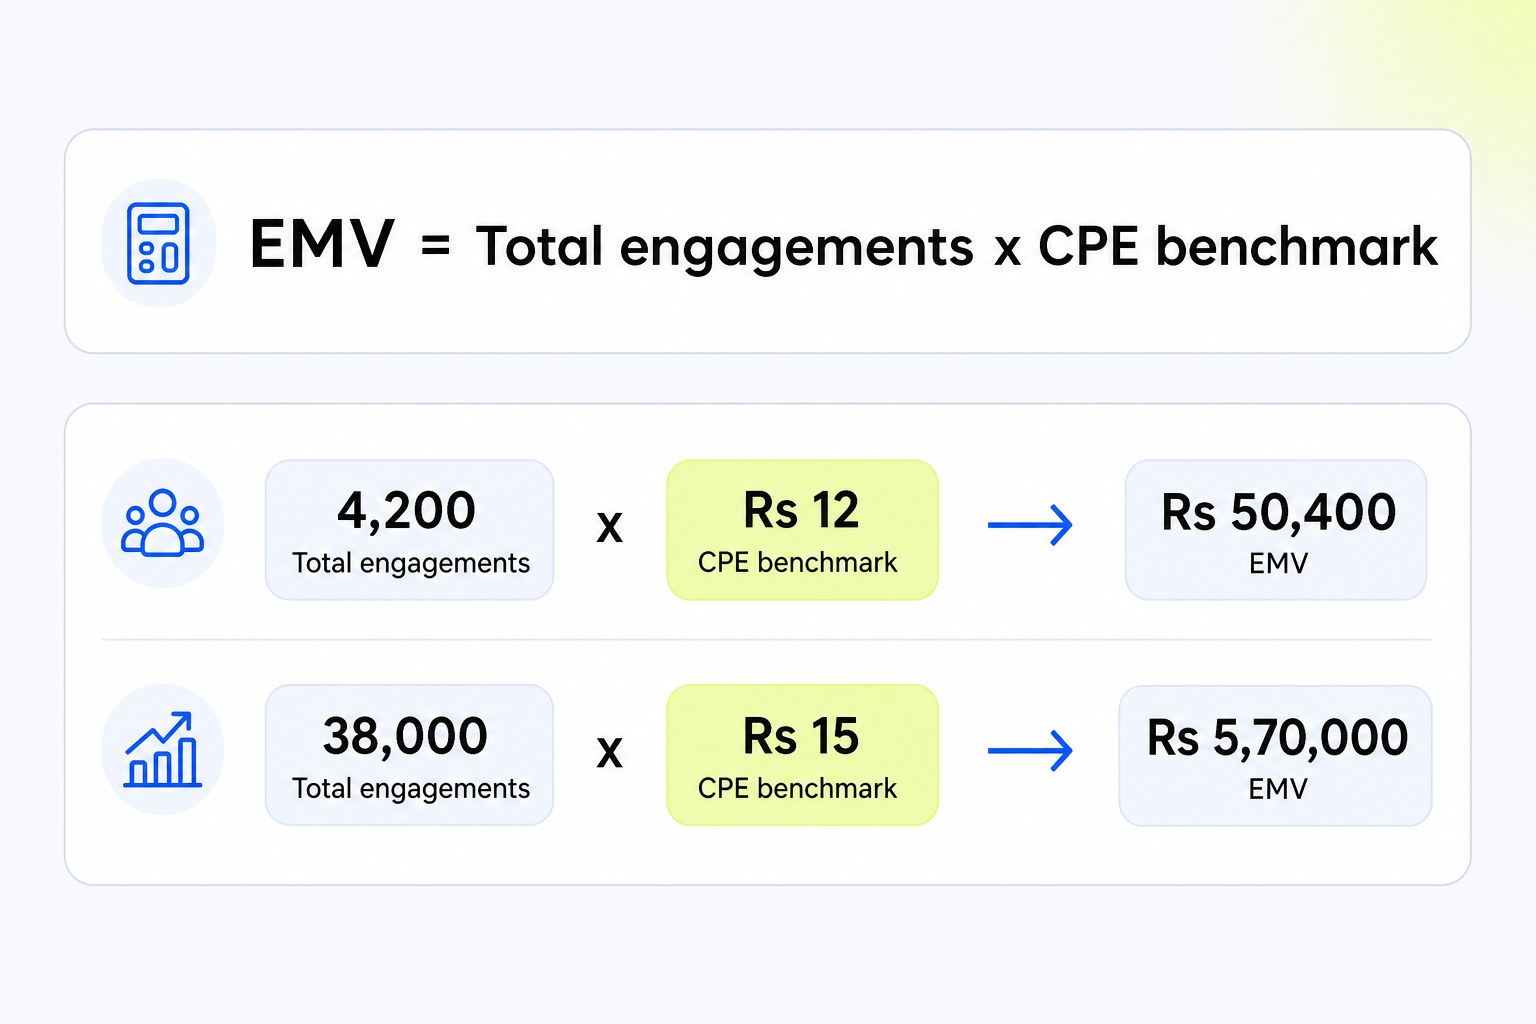
The formula is short.
EMV = total engagements x cost-per-engagement benchmark
Total engagements usually means likes, comments, shares and saves. Some teams add views, especially for YouTube and Reels. The CPE benchmark is what one engagement would have cost you through paid media on that platform.
Example 1: one creator
A micro creator posts for a skincare brand and the Reel picks up 4,200 engagements. If the CPE benchmark for Instagram beauty content is Rs 12, the EMV is 4,200 x Rs 12 = Rs 50,400.
Example 2: a campaign of 8 creators
Eight creators together generate 38,000 engagements across Instagram and YouTube. The blended CPE benchmark for the campaign is Rs 15. The EMV is 38,000 x Rs 15 = Rs 5,70,000.
Notice how much the benchmark matters. The same 38,000 engagements at a Rs 6 benchmark give Rs 2,28,000. At Rs 18 they give Rs 6,84,000. CPE varies by platform, category, creator tier and format, so there is no single fixed industry number. The most defensible option is your own brand’s past paid-media CPE for that platform. If you do not have one yet, say so on the slide and label the benchmark as an assumption.
The same formula runs forward as well as backward. Media planning in the Influencer Suite estimates expected engagement, EMV and ROI for a shortlist before you commit budget, so the benchmark you pick at planning time is the one you report against later.
Where EMV comes from in influencer marketing
EMV does not come from one channel. It builds up across every place people talk about, share or react to a brand without that attention being bought as an ad.
- Creator content. Posts, Reels and videos creators publish about a product to their own audience on Instagram, YouTube or TikTok.
- Shares and mentions. The smaller interactions around that content: comments, Story reshares, saved Reels, tags and mentions.
- User-generated content. Unboxing videos, reviews and duets from people who bought the product and were never briefed.
- Word of mouth. A recommendation in a WhatsApp group that later turns into a search, a comment or a tag.
None of this is paid media. It is attention the brand earned, and EMV is a way of putting a value on it.
What EMV measures, and where it falls short

EMV measures potential value. It does not measure what happened after someone engaged, and that gap is where most of the confusion starts.
What it does tell you: the scale of attention a campaign pulled in without paid promotion, and roughly how much engagement you got for the fees you paid. Rs 48 lakh in EMV off a Rs 6 lakh spend reached and engaged far more people than a Rs 5 lakh spend on the same platform, assuming similar audience quality.
What it does not tell you:
Whether the engagement was good news or bad news
A comment section blowing up over a controversy adds to EMV in exactly the same way as a comment section full of genuine excitement. The formula counts interactions. It has no opinion on whether they helped or hurt the brand.
Whether anyone converted
EMV says nothing about product page visits, link clicks, discount code use or sales. A campaign with a modest EMV can outsell one with a huge EMV, depending on audience quality and the strength of the call to action.
Whether the benchmark was realistic
Most CPE benchmarks used in EMV calculations are industry averages, not the brand’s own numbers. If your actual paid CPE on Instagram is Rs 6 and the calculation used Rs 18, your EMV comes out 3 times larger than it should.
None of that makes EMV useless. It means the number on its own tells leadership less than it appears to.
Read EMV next to the numbers that fill its gaps
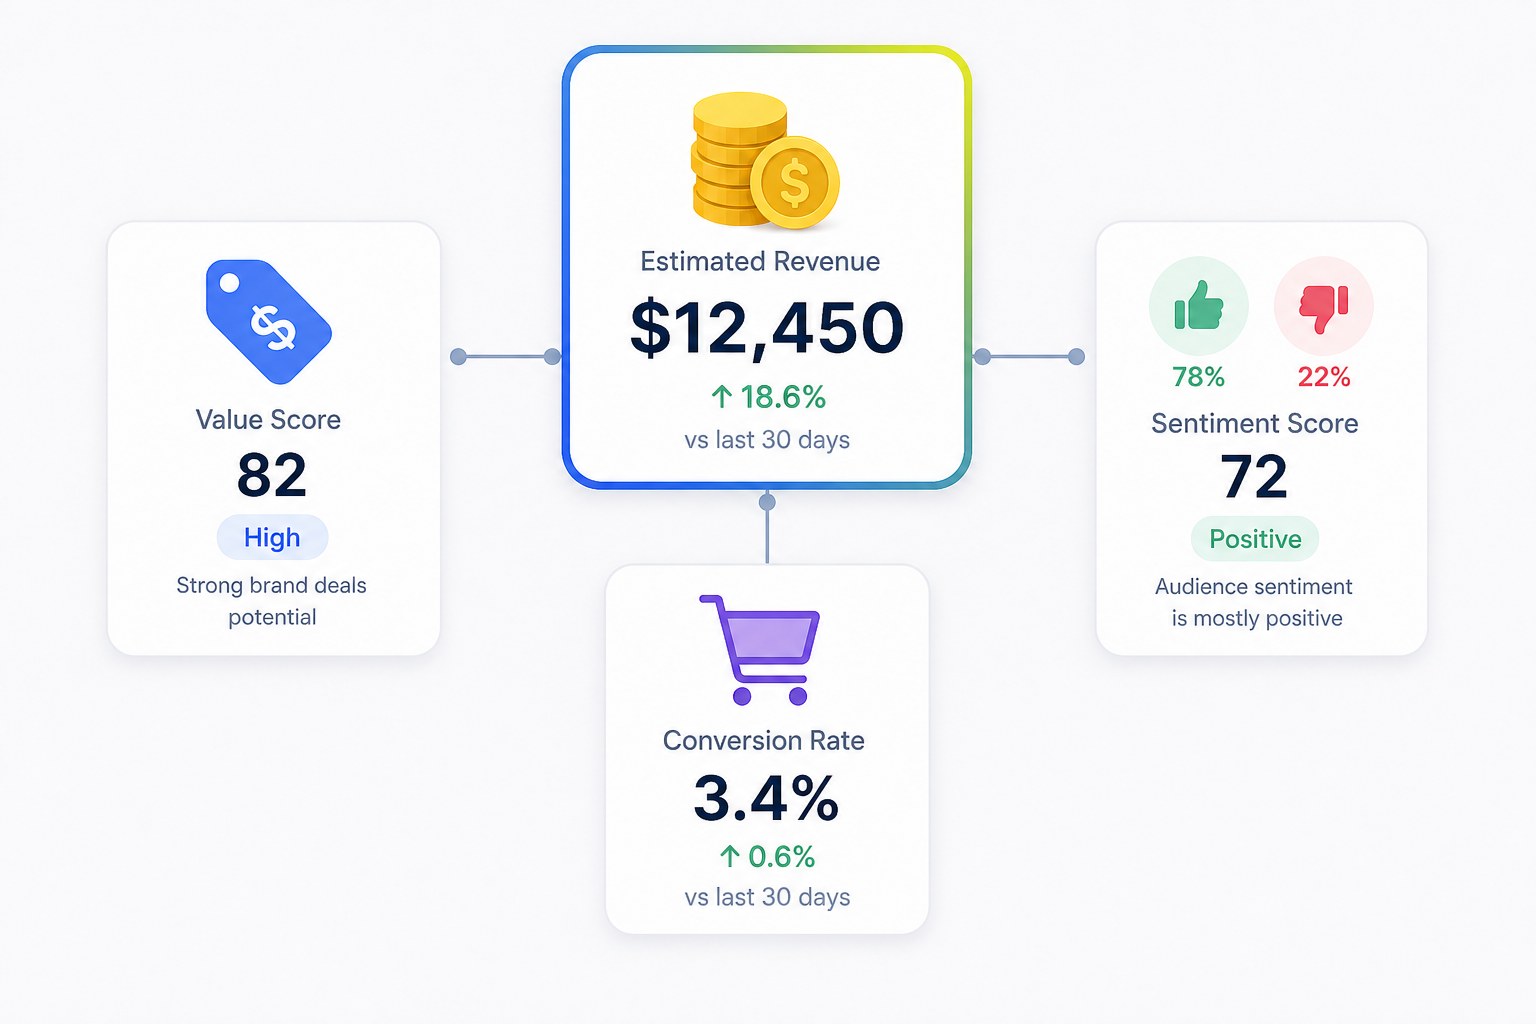
EMV makes sense when it sits beside the metrics that show cost, audience response and outcomes. Three pairings cover most of it.
| Pair | What EMV tells you | What the second metric adds |
|---|---|---|
| EMV and CPE | The value the campaign created | What you paid per engagement, so you can judge efficiency |
| EMV and sentiment | How many interactions you earned | Whether those interactions were positive, negative or neutral |
| EMV and conversions | The attention the campaign generated | Whether that attention turned into clicks, sign-ups or sales |
Timing matters too. A review or tutorial published on day 1 of a campaign is still picking up saves and profile visits weeks later. Pull the EMV figure the week a campaign closes and you undercount what the content eventually earns. That is why the Tracking Suite keeps EMV per creator updating in real time alongside CPE, CPV, engagement rate and sentiment, instead of freezing the number at wrap-up.
This is also where the manual version breaks. HealthifyMe had 2,000+ content pieces to monitor across its campaigns. Moving that tracking into CultureX cut analysis time by 75%, and campaign ROI rose 60% because the team could see which creators were earning attention while the campaign was still live. The HealthifyMe case study walks through the setup.
How EMV changes by creator tier
EMV shifts a lot by creator tier, because both engagement and fees change as follower count grows.
| Tier | Followers | What EMV usually looks like |
|---|---|---|
| Nano | 1K to 10K | Small absolute EMV, often the best EMV per rupee spent. Fees are low and engagement is high, especially for regional creators in Tier 2 and Tier 3 cities. |
| Micro | 10K to 100K | The usual middle ground. Meaningful EMV without the sharp fee jump of larger creators. |
| Mid-tier and macro | 100K to 1M | Bigger EMV numbers, bigger fees. Adds scale, but efficiency is not always as strong as it looks at first. |
| Mega | 1M+ | The highest EMV figures. Reach is broad enough that the investment behaves like a paid media buy. |
A single EMV total across a mixed roster hides this. Break EMV down per creator and the tier that earned its fee becomes obvious.
3 questions to ask before EMV goes in front of leadership

1. Which CPE benchmark did you use, and does it match your real paid rate?
A benchmark that is far from your actual Instagram or YouTube CPE is not a fair comparison. It can inflate or deflate the number by a wide margin, and the first finance person to ask will find it.
2. What did sentiment look like behind the figure?
If your biggest EMV contributor also picked up a wave of negative comments, the headline number needs a footnote before it goes anywhere near a deck.
3. Is the number final, or a snapshot from launch week?
Long-form content, especially reviews and tutorials, keeps earning engagement well after the campaign wraps. Say which date the figure was pulled on, and show the trend rather than a single point.
If the 3 answers hold up, EMV is a fair way to show the scale a campaign reached. Pair it with share of voice and you can show both how big the campaign was and whether it moved your position in the category.
See CultureX in action
Track EMV per creator next to CPE, sentiment and conversions in one live report, with no screenshots.
Frequently asked questions
What is earned media value (EMV)?
EMV is an estimate of what the engagement your influencer content earned would have cost through paid advertising. You get it by multiplying total engagements by a cost-per-engagement benchmark.
How do you calculate earned media value?
Multiply the engagements a piece of content generated (likes, comments, shares, saves) by a CPE benchmark for that platform and category. A post with 4,200 engagements at a Rs 12 benchmark is Rs 50,400 in EMV.
What is a good EMV for an influencer campaign?
There is no single number. EMV depends on creator tier, platform, category and the benchmark you apply. The better question is whether EMV looks reasonable next to your CPE and conversion figures for that campaign.
Why is EMV not the same as revenue?
EMV values likes, comments and shares. Revenue depends on whether that engagement led to sales. A campaign can post a large EMV and sell very little, or the reverse.
What is the difference between EMV and CPE?
EMV estimates what your earned engagement would have cost through paid media. CPE is what you paid per engagement in your own campaign. Read together, they show how efficient the campaign was.