
The short version
- Generic “best time to post” advice is an average of millions of accounts. Your followers are not the average.
- A performance heatmap built from your own posts shows the days and hours your audience actually shows up, and separates reach peaks from engagement peaks.
- Re-read it every quarter, after a big follower jump, or when you change how often you post.
Every guide says the same thing. Post at 9 AM on a Tuesday. So you do, and 3 days later the reach is nowhere near what you expected.
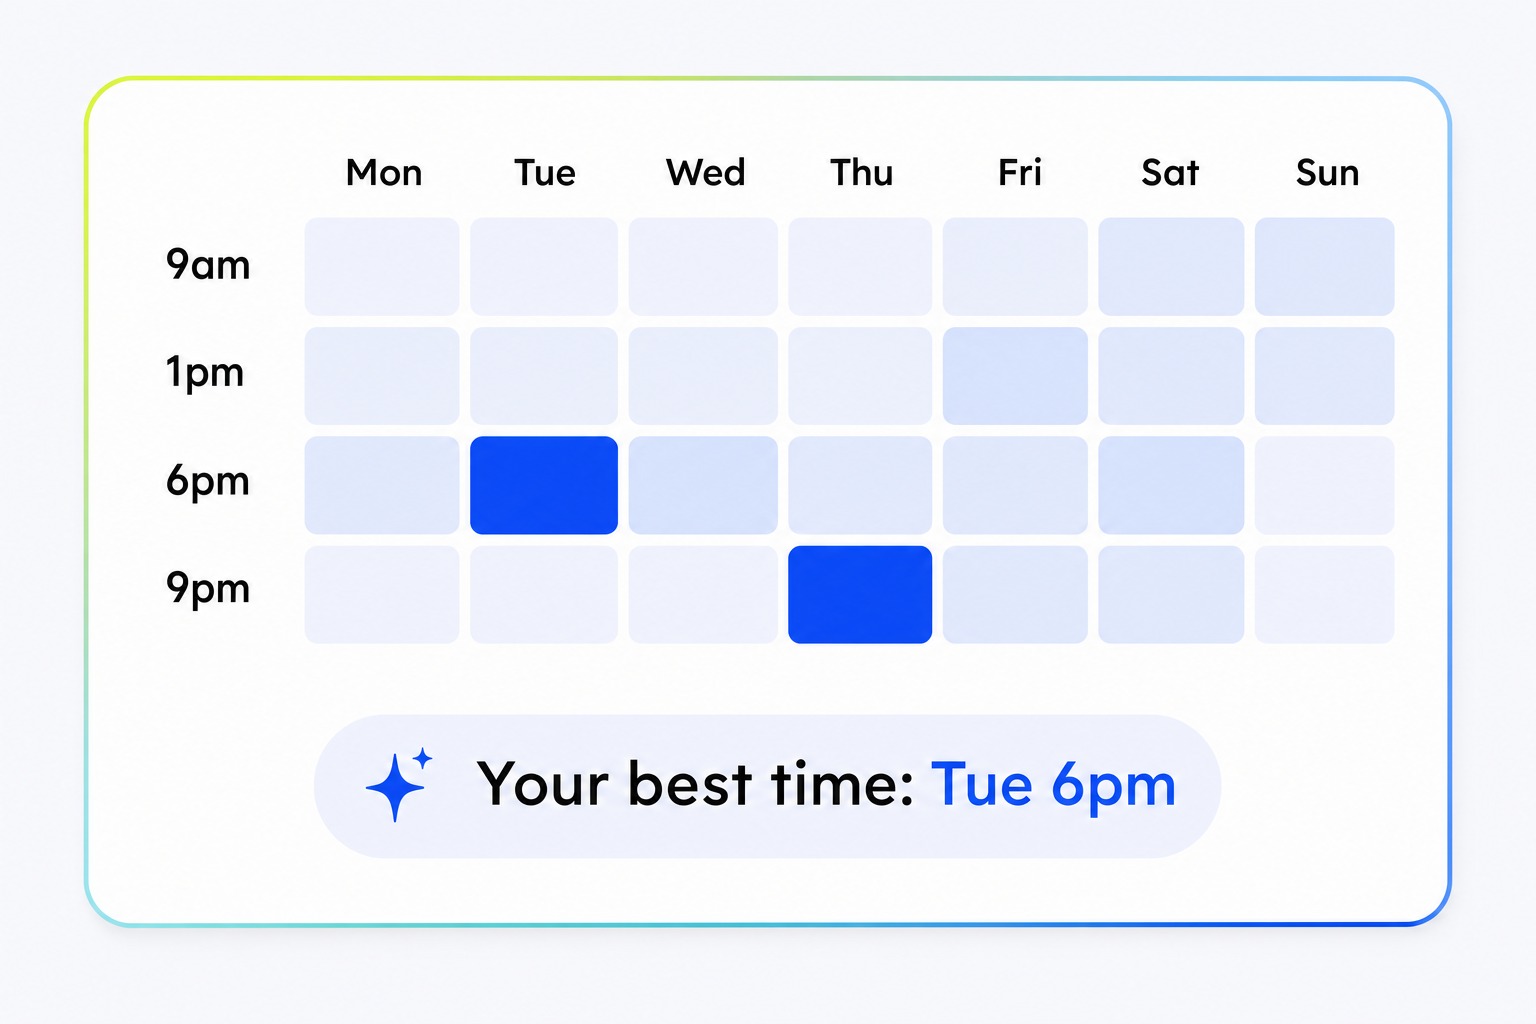
The guide is not wrong, exactly. It is an average. Those recommendations come from engagement data across millions of accounts. Your followers are a specific group of people with specific scrolling habits, and there is no reason they should match the average.
So when you are working out when to post on Instagram, stop asking the platform. Ask your audience. The only data that can answer is your own.
Why generic best-time advice does not fit your brand
Best-time recommendations are built by averaging performance across thousands of accounts. If Tuesday mornings win across millions of posts, Tuesday morning becomes the advice. That holds for the average account. It says nothing about yours.
Picture a beauty brand whose followers are mostly women aged 25 to 40 in Indian metros. Their day looks nothing like a gaming brand’s followers, who are students scrolling after midnight. A Coimbatore jewellery brand whose customers run family businesses will find its audience free after the shop shuts at 9 PM, not at 9 AM. If all 3 follow the same Tuesday 9 AM rule, at most one of them gets lucky.
Brands with consistent organic reach rarely follow a universal guide. They follow their own pattern, and that pattern only becomes visible once there is enough posting history to read it.
What a performance heatmap shows you
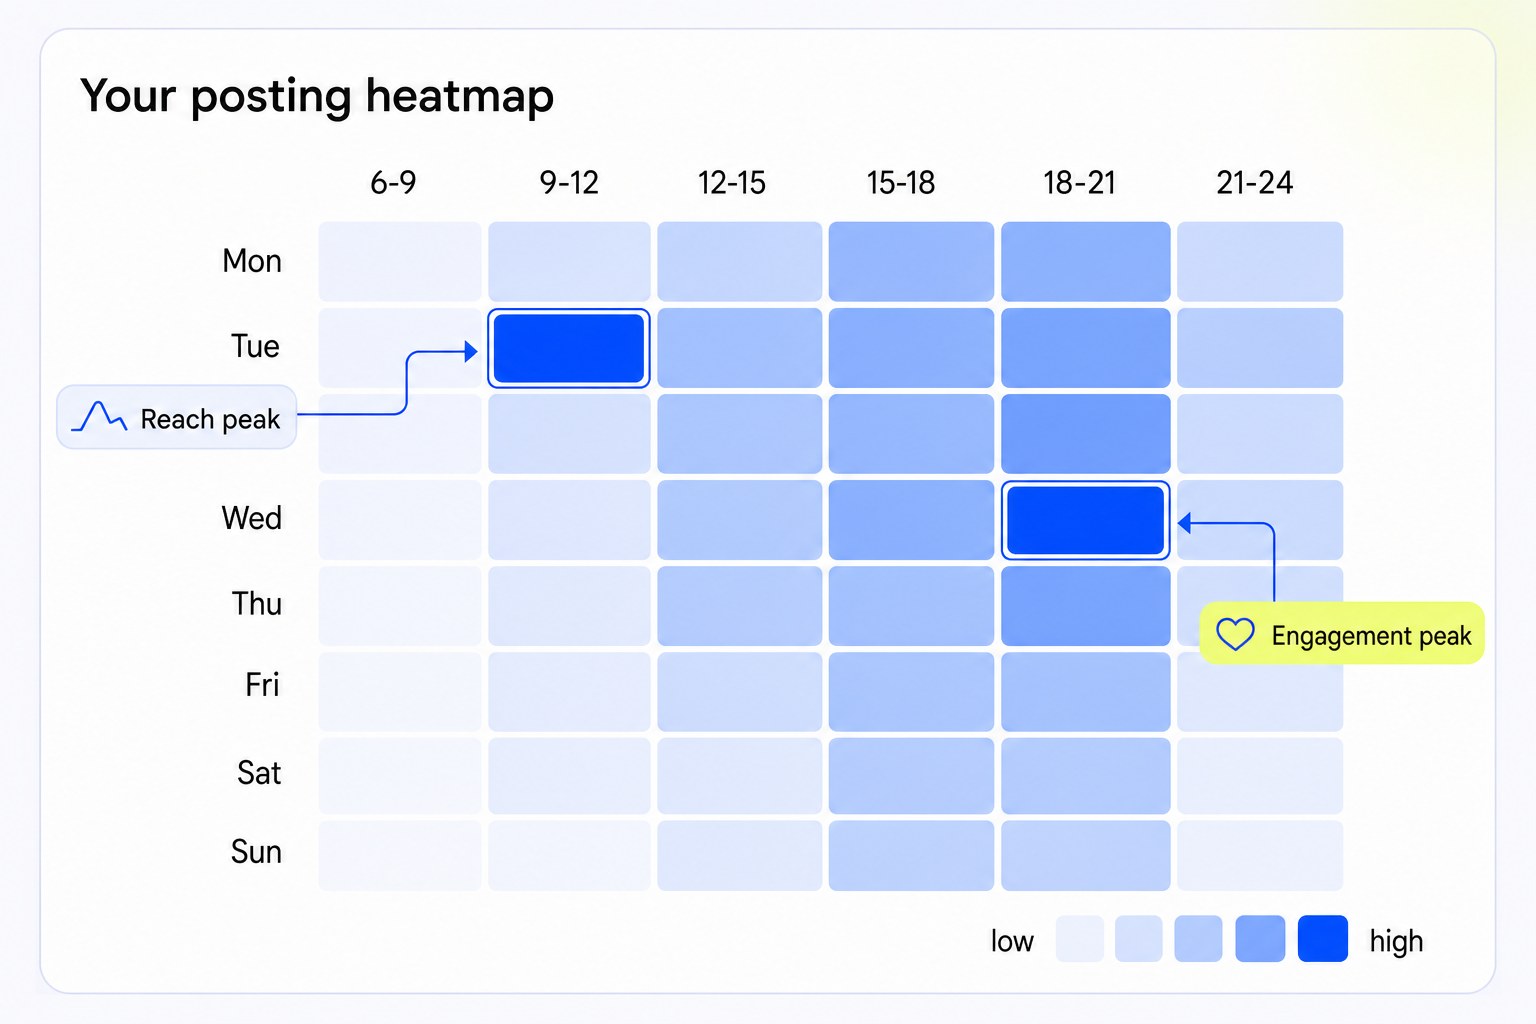
A performance heatmap is a grid built from your own posting history. Days run one way, time slots the other, and every cell is coloured by how posts published in that slot performed. Strong windows stand out, weak windows fade. It takes seconds to read.
What goes in
Every post the brand has published, the day it went out, the time it went live and how it performed. Nothing from other accounts. That is the whole difference from a generic guide: the pattern is what has worked for your audience on your content, not what works across the platform.
What comes out
- Best days. The days that have consistently produced better results for your audience, which may not be the days the platform average favours.
- Best windows within each day. Wednesday evenings can beat Wednesday mornings while Friday is the reverse. This is rarely intuitive.
- Typical reach per slot, not the best ever. A calendar should be built on what a slot reliably delivers. One viral post in a Sunday slot does not make Sunday your best day.
- How often you post in each slot. Useful context, especially if you changed your cadence recently. A slot with 2 posts is not a pattern yet.
CultureX’s Tracking Suite builds this heatmap from the brand’s connected social accounts, so nobody has to export 6 months of posts into a spreadsheet to find the pattern. For the wider set of reports a tracking tool should give you, see what a social media analytics platform does.
Reach peaks and engagement peaks are different windows
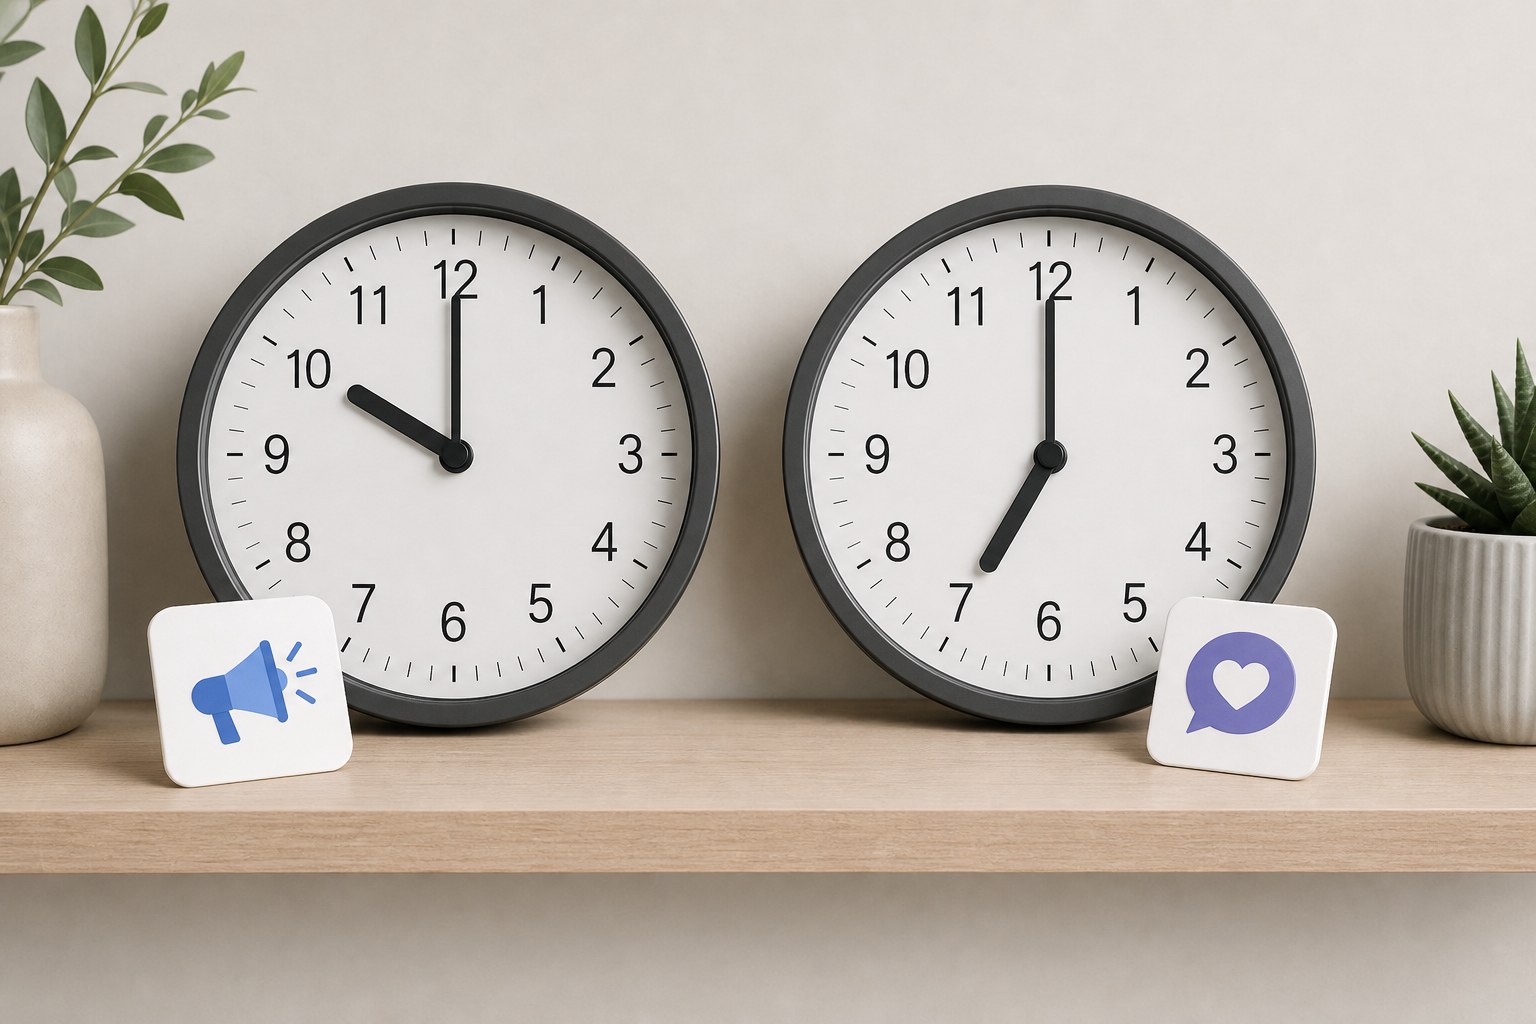
The natural assumption is that they are the same slot. Usually they are not.
Most brands treat posting time as one decision: find the best slot, schedule everything there. But “best” depends on what the post is for. A heatmap captures 2 patterns. The window where content reaches the most people, and the window where it gets the most comments, saves and shares. They fall on different days more often than you would expect.
Back to the beauty brand. Its heatmap shows Tuesday at 10 AM gets the widest reach. Thursday at 7 PM gets fewer views but far more comments, saves and shares. 2 windows, 2 jobs. Tuesday morning is for the product launch. Thursday evening is for the poll asking followers which shade to release next.
When to post for reach
Reach peaks give a post the widest initial distribution. More people see it in the first 2 hours, which gives the algorithm a stronger reason to push it further. Launches, announcements, festive pushes and anything you need as many people as possible to see go here.
When to post for engagement
Engagement peaks are when your audience is actively scrolling rather than passively browsing, so they stop and respond. Questions, polls, UGC callouts and conversation starters belong here. A smaller initial reach with a high interaction rate can travel further than a big reach with low engagement.
Once both windows are visible, you make the choice deliberately for each post instead of defaulting every post to one slot.
How to put the heatmap into your content calendar
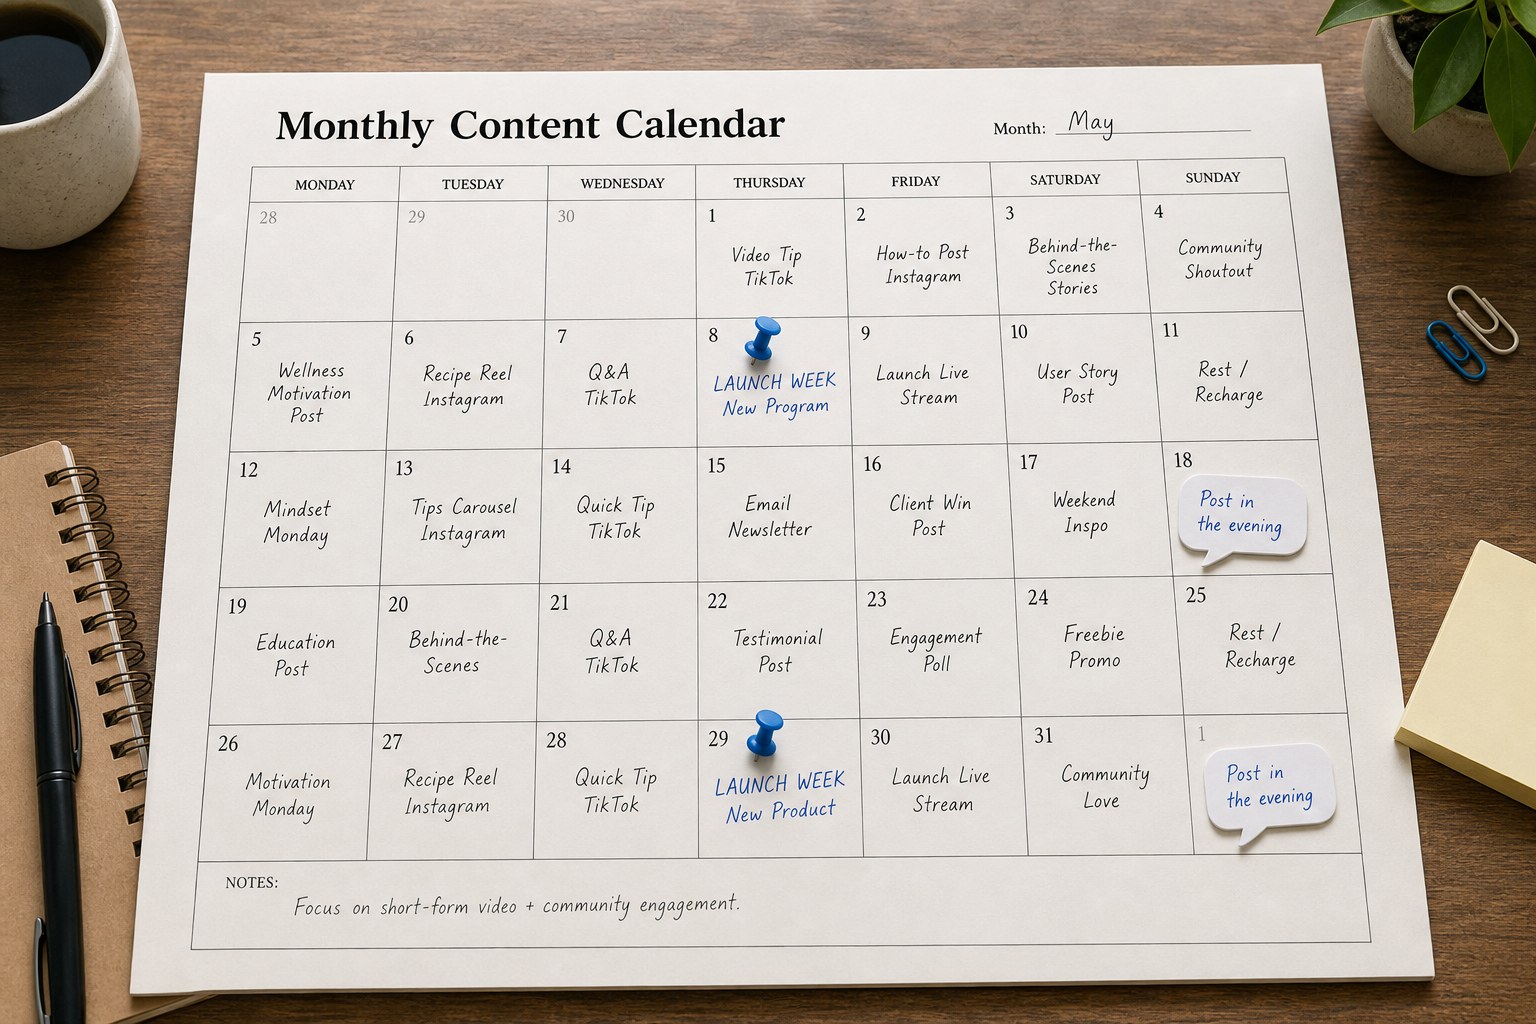
Campaign timing usually gets decided by when the creative is ready, when the product launches, or a vague preference for mid-week. The heatmap adds one more input. The question changes from “when does the platform recommend?” to “when does my audience show up?”
Hero content goes into reach peaks
Before a launch week, pull the heatmap and find the 2 strongest reach windows. Schedule the hero post, the launch Reel and the announcement there. Secondary content takes the secondary peaks. If the data says Friday evenings beat Monday mornings on reach, a Monday launch is a decision against your own evidence.
Community content goes into engagement peaks
Polls, question stickers, replies in Stories and anything that exists to start a conversation should sit in the interaction windows, even if the reach number there is smaller.
Put posting windows into influencer briefs
Most briefs say what to post and how. Few say when, beyond a go-live date. Add the brand’s strongest windows as a recommended posting time and the creator’s post lands when your audience is around. It is one line in the brief, next to the tracked link and the disclosure wording, and the Influencer Suite keeps that brief inside the campaign workflow where the creator sees it. The rest of the briefing stage is covered in our guide to how to hire influencers.
3 signals it is time to re-read the heatmap
Posting schedules drift. Here is when to revisit yours.
The peaks have moved
A slot that worked last quarter slowly stops working while another improves. You will not notice on any single post, only in the pattern. A quarterly check catches it before it costs you a launch.
A big campaign brought in new followers
New followers bring new habits and new active hours. After a large influencer campaign or a viral moment, re-read the heatmap within a few weeks, because the old pattern describes an audience you no longer have.
Your posting frequency changed
Once a week 6 months ago, 3 times a week now: the grid looks different simply because there is more data in it, and recent posts weigh more. Make sure the pattern you rely on is built from the account you run today. A heatmap that refreshes from recent posts, rather than a one-time export, takes care of this on its own.
3 questions before the next post goes live
- Is this post for reach or for engagement? A launch and a poll are both Instagram posts. They should not go out at the same time by default.
- Is the slot from our heatmap or from a generic guide? With 6 months of consistent posting behind you, your own grid beats any external recommendation.
- When was the heatmap last reviewed? An old pattern beats no pattern, but check how current it is before a high-stakes post.
Posting time is not a one-time decision. It shifts as the audience grows and as new followers arrive. Treat it as a living input to the calendar. The pattern already exists in your data. The only question is whether you are reading it. For the bigger picture on what your numbers can tell you, our post on the 4 types of social media analytics is the place to go next.
See CultureX in action
See your own reach and engagement windows, built from your posting history instead of the platform average.
Frequently asked questions
When is the best time to post on Instagram in India?
There is no single answer that works for every brand. A metro office audience, a student audience and a Tier 2 family audience are all active at different hours. The reliable answer comes from your own posting history, read as a heatmap, not from a platform average.
Does posting time really affect reach and engagement?
Yes, but not the same way for every account. Posting when your audience is active gives a post a stronger start in its first 2 hours, and that early response affects how far the algorithm distributes it.
What is a performance heatmap?
A grid that maps your content’s historical performance across every combination of day and time you have posted. It shows which windows consistently produce stronger reach and engagement, using your own data only.
What is the difference between a reach peak and an engagement peak?
A reach peak is the window where a post gets the widest initial distribution. An engagement peak is the window where your audience is most likely to comment, save and share. They often fall in different slots and suit different kinds of content.
How often should I update my Instagram posting schedule?
A quarterly review is enough for most brands. Look sooner if you have run a big campaign, gained a lot of new followers, or changed your posting frequency.