
The short version
- A social media report has 2 jobs: show what changed, and say what to do next. Most reports only do the first.
- The template below has 8 sections. 5 go to the client, 3 stay internal. Copy the table and fill it in.
- Once you manage more than 1 or 2 accounts, connect them to a live dashboard so the report rebuilds itself instead of you rebuilding it every month.
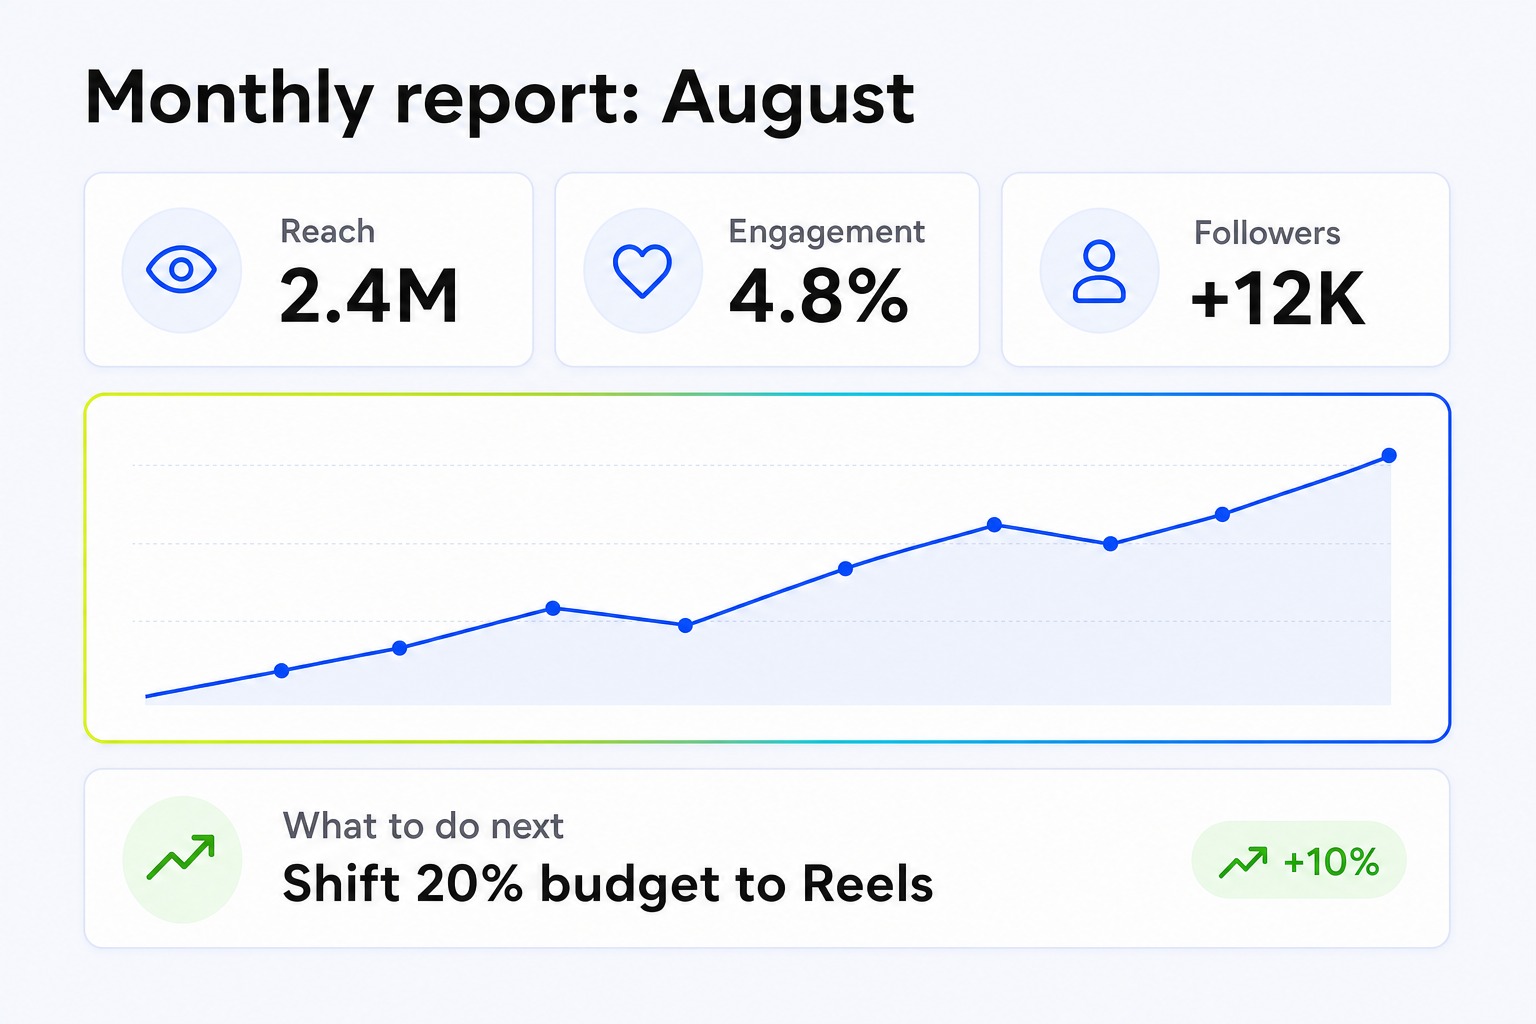
It is the 3rd of the month. The deck has 14 slides, 9 charts and 1 sentence of commentary. The client reads it on a phone between meetings, sees that reach went up and engagement went down, and asks the only question that matters: “So what do we do differently in April?”
That question is what a social media reporting template is for. The numbers are easy. Every platform hands them to you. What most reports miss is the context: what changed, why it changed, and what it means for next month. This post covers what belongs in a social media report, how to shape it for the person reading it, and a ready-to-fill template with every section laid out.
What a social media report needs to include
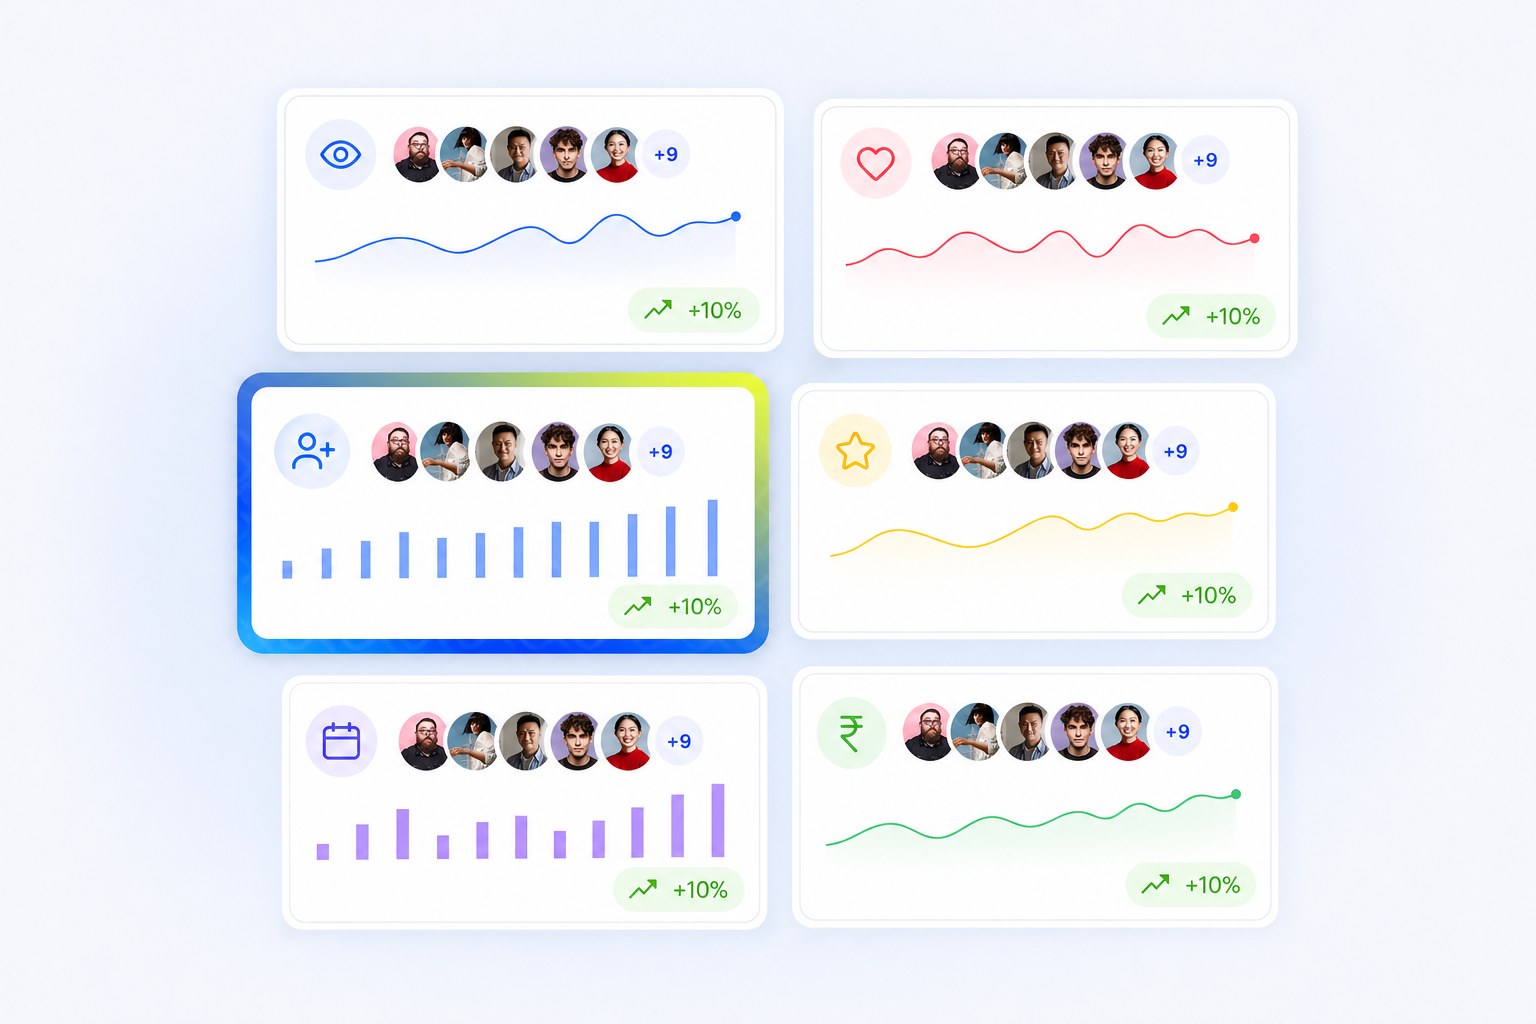
Start from the decision-maker, not from the export. The question to ask of every metric is whether it helps someone decide if the strategy is working. If it does not, it goes in the appendix or nowhere.
These 6 categories belong in every social media KPI report:
Reach and impressions
Reach is the number of unique accounts that saw the content. Impressions is the total number of times it was shown. Both matter, but reach is the more useful number for understanding real audience size.
Engagement rate
Total interactions divided by reach or by followers, depending on the platform. Raw likes without a rate give the reader no way to tell whether the number is good or bad relative to audience size, or relative to last month.
Follower change over the period
Report the change rather than only the current count, and say whether the rate is speeding up or slowing down. A flat follower count after a high-output month is a signal worth naming in the summary.
Top-performing content
List the posts with the best results, then say what they had in common. Same format, same topic, same posting slot. The pattern across 3 high performers is worth more than any single result.
Posting frequency and consistency
How often content went out and whether it was spread evenly across the period. For organic growth, consistency matters more than volume.
Paid spend tied to the period
If budget went behind any post, separate paid from organic so the 2 are never judged against the same benchmark.
Shape the report around who reads it
One report cannot serve everyone. A client who wants a 2-minute read before a call needs something different from an internal team doing a full content review. In practice you are building 3 things.
The client version
The headline numbers, a 3 to 4 line note on what changed and why, and a short list of takeaways. Clients and leadership do not need raw tables or platform-by-platform breakdowns unless they ask. The job is to show whether the strategy is working in as few words as possible.
The internal version
The full metrics breakdown per platform, performance at the post level, and a section on what to test or change next month. This is the version that changes decisions.
The month-on-month view
Build the comparison into the structure from day 1. If the template does not show the previous period next to the current one, nobody can judge the result at a glance. A common setup is 1 master data sheet feeding 2 output views, 1 for the client and 1 for the team. The template below is built with that split in mind.
The template: layout and sections
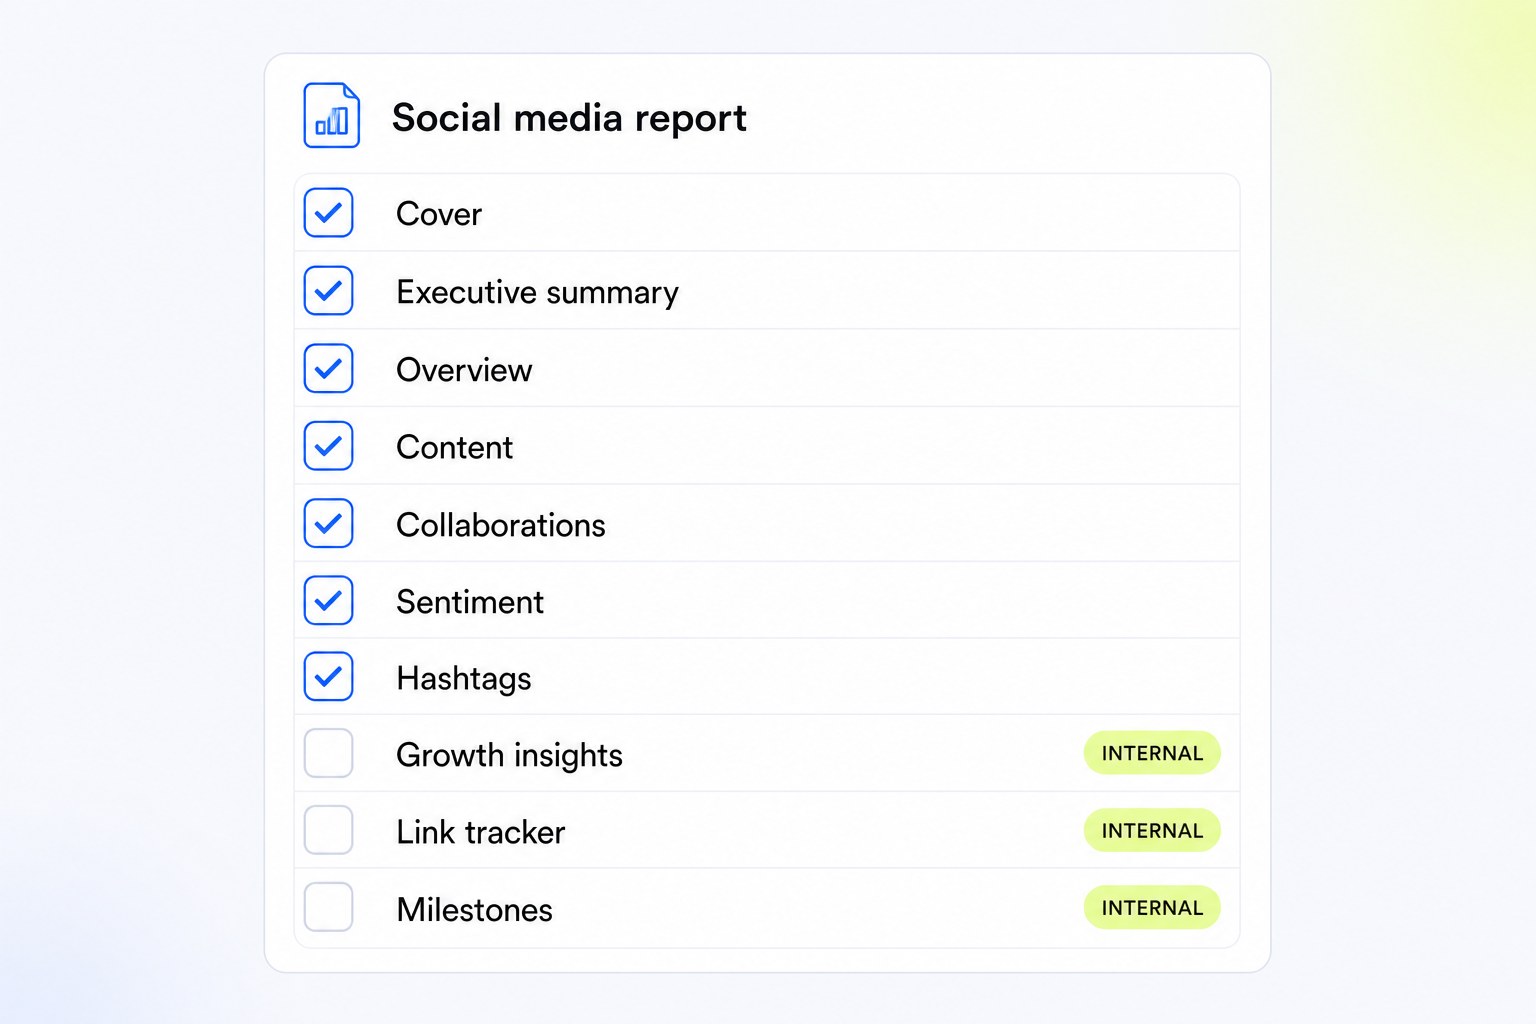
Copy this table into your document and fill in the right-hand column. Sections marked internal stay out of client-facing reports.
| Section | What goes in it | Client-facing? |
|---|---|---|
| Cover | Brand name, reporting period, prepared by, report date | Yes |
| Executive summary | 3 to 4 plain lines: what the period looked like, 1 thing that worked, 1 that did not, 1 focus for next month | Yes |
| Overview | Per platform: followers, reach, impressions, engagement rate, with the previous period alongside | Yes |
| Content | Top posts by views and engagement rate, with a short note on why each worked | Yes |
| Collaborations | Per creator partnership: views, likes, comments, cost if relevant | Yes |
| Sentiment | Positive, neutral and negative split from comment analysis, plus the top comment intent | Yes |
| Hashtag performance | Hashtags tracked, post volume, average views and engagement per tagged post | Yes |
| Growth insights | Longer-term trend, posting frequency by weekday | Internal |
| Link tracker | Clicks, traffic source, device and location per tracked link | Internal |
| Milestones | Progress against the targets set for the quarter | Internal |
A few notes on how each section is meant to work.
Cover. One line each. It sounds trivial until a client has 5 agency decks open at once.
Executive summary. No metrics, no buzzwords. Write it the way you would say it on a call. If the summary reads well on its own, the rest of the report is backup.
Overview. This is the section people actually read. Put the previous period next to the current one so the comparison needs no explanation.
Content. The pattern across several high performers matters more than the single best post. If the top 3 are all Reels under 20 seconds, say so.
Collaborations. Only if creator partnerships ran during the period. Useful for brands running influencer activity alongside owned content, which is most Indian D2C brands at festive season.
Sentiment. The qualitative layer that engagement numbers cannot give you. “Comments up 30%” means something different when half of them are complaints about delivery.
Hashtags. Campaign hashtags and always-on branded tags. Post volume and average engagement per tagged post are the 2 numbers worth reporting.
Internal sections. Growth insights, link tracking and milestones are for the team. They answer “are we on track” rather than “what happened”, and that is a different conversation.
What the template looks like once it is automated

The template works because it gives a brand or client a structured view of what their social presence is doing. The weak point is the rebuild. Every cycle starts with pulling data platform by platform and pasting it into the same cells. For 1 account that is an hour. For 8 client accounts it is a week of someone’s month.
The Tracking Suite is what this template turns into once the accounts are connected. It is a live dashboard built from the brand’s own account data, and it produces the same sections above without the monthly rebuild:
- Overview and growth: follower growth, engagement, views and reach across Instagram, YouTube, TikTok and Facebook in 1 dashboard instead of 4 exports.
- Content performance: recent posts with views, likes, comments and engagement rate per post, and a deep analysis view that reads further back into the account’s history for longer-term patterns.
- Sentiment and comments: comments sorted into positive, negative and neutral, with intent labels such as product feedback and purchase intent, updated as new comments arrive.
- Hashtag tracking: branded or campaign hashtags tracked across platforms and pulled straight into the report.
- Link tracking: trackable links per creator or campaign with clicks, traffic source, device and location.
- Shareable output: reports shared as a link, so the client sees the same live data the team is looking at.
The scale this matters at is real. HealthifyMe tracked 2,000+ content pieces through the platform and cut analysis time by 75%. Nobody rebuilds a spreadsheet for 2,000 posts.
If you want the background on what each of these numbers can and cannot tell you, read the 4 types of social media analytics first. For the wider category, see what a social media analytics platform does day to day.
How to use this template

The template is deliberately fuller than any 1 brand needs. Cut it to the campaign. A brand running creator campaigns will lean on the collaborations and sentiment sections. A brand focused on organic growth cares about follower trend and content performance. If the only goal is reach, most of the breakdown can go.
Agencies reporting to several clients should set the client view once and reuse it. The agency setup lets the same dashboard carry your own branding, so the report the client opens looks like yours. The free Starter plan on the pricing page is enough to see the layout before committing to anything.
See CultureX in action
Watch this exact report update itself from your own accounts, no monthly rebuild.
Frequently asked questions
What should a social media reporting template include?
A cover, a short executive summary, platform-by-platform performance with the previous period alongside, the key metrics (reach, impressions, engagement rate, follower change, posting frequency), and your top content with a note on why it worked. End with clear priorities for next month. The report should explain what changed, why, and what to do about it.
How often should a social media report go to a client?
Monthly is the default because it gives enough time for real trends to show without flooding anyone with data. Campaign reports go out when the campaign ends. Weekly reports make sense for fast-moving launches or clients who ask for them. Match the cadence to how often the client makes decisions.
What is the difference between a monthly report and a campaign report?
A monthly report covers overall account health over the month: audience growth, engagement, reach and content performance. A campaign report covers 1 campaign against its own objectives, such as views, clicks or conversions, over whatever window the campaign ran. Monthly reports show the big picture. Campaign reports judge 1 effort.
Is there a free social media reporting template here?
Yes. The table above is the template. Copy it, fill in the sections that fit your brand and drop the rest. If you want the same structure to update itself, connect your accounts to the Tracking Suite. The Starter plan is free and a demo shows it running on your own accounts.
How do I automate social media reporting instead of building it every month?
Connect the brand’s accounts to a reporting dashboard that pulls cross-platform metrics into 1 view and keeps them current. Share the report as a link rather than a file. The structure your team and clients already use stays the same. The copying and pasting goes away.