
The short version
- There are 4 types of social media analytics: descriptive (what happened), diagnostic (why), predictive (what next) and prescriptive (what to do).
- Most tools do the first 2 well. Predictive is usually oversold and true prescriptive is rare, whatever the pricing page says.
- Before you buy, ask a vendor to show each type on your own account data, not on a demo brand.
A brand manager in Pune opens the dashboard on a Monday. Engagement is up 12% for the month. Follower growth is flat. She has 20 minutes before the review and 1 question: is that good news or a warning?
The dashboard cannot tell her. It reports numbers. It does not explain them, forecast them, or recommend anything. That gap is exactly what the 4 types of social media analytics are meant to describe. Most tools sold as “social media analytics” cover 2 of the 4, and most buyers find out months in when they hit a question the tool cannot answer. Here is what each type means in plain terms, with a worked example, and which ones a typical tool covers versus quietly skips.

Descriptive analytics: what happened
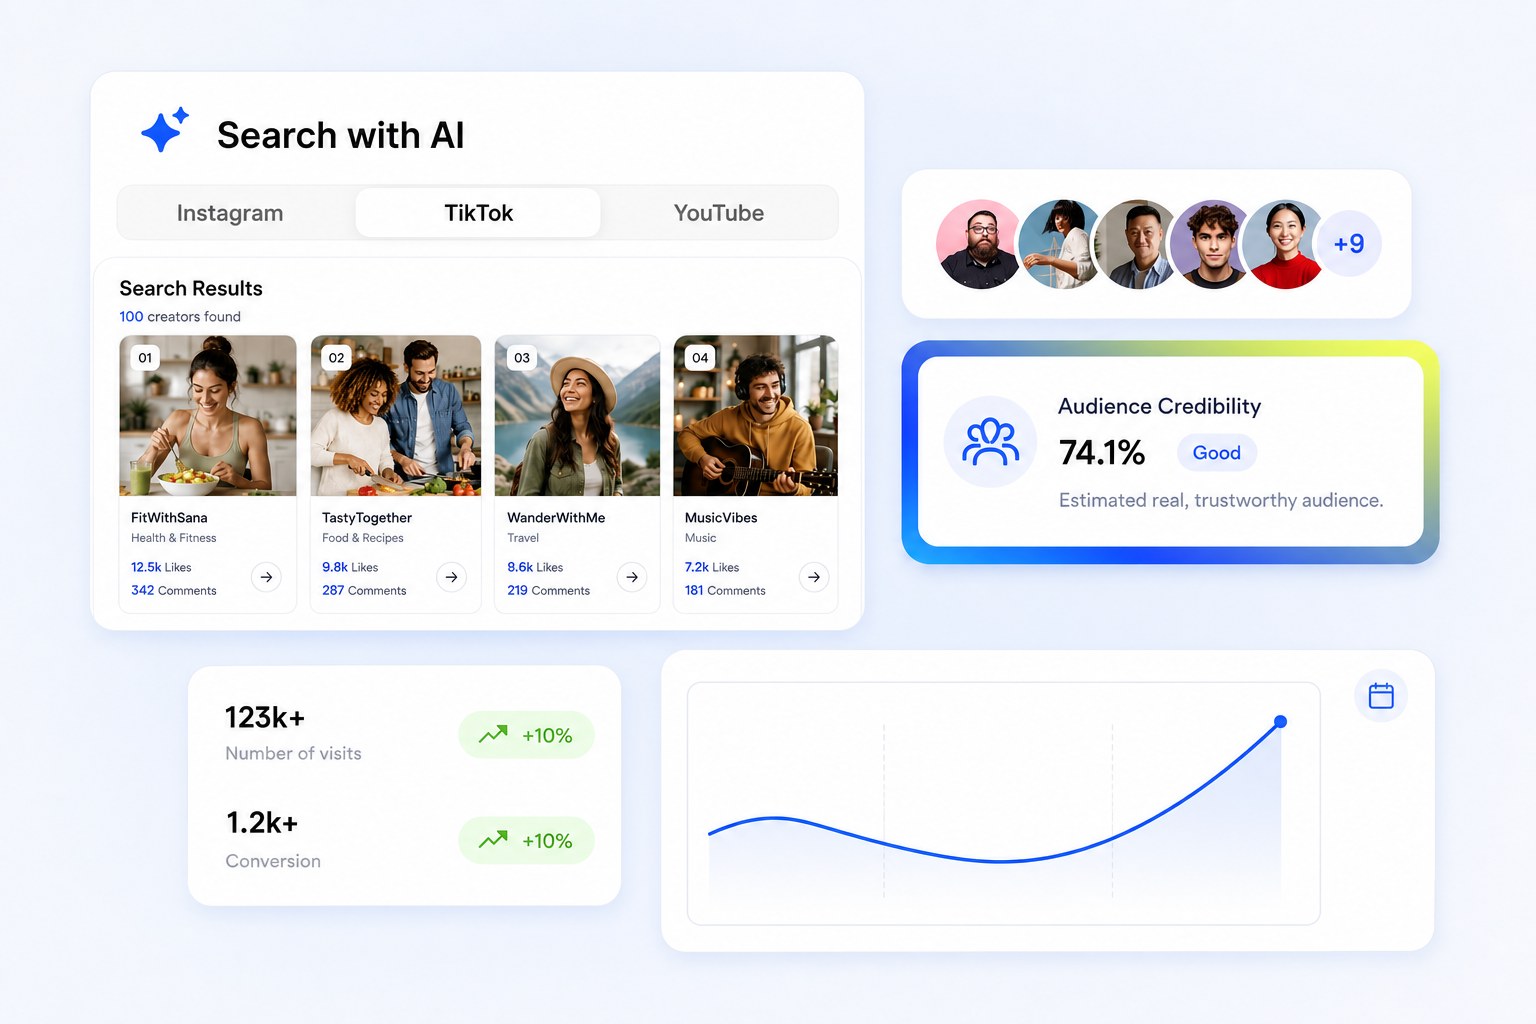
Descriptive analytics is a record of the past. Last week’s engagement, the reach of a post, follower growth over the month, which post got the most likes. It reports the result and stops there.
This is the layer almost every tool has, because it is the easiest data to collect and the first thing anyone checks. A graph of engagement rate over the last 3 months is descriptive analytics. It is a snapshot, and a useful one. It just does not tell you what caused the line to move.
Go back to the Pune example. Engagement up 12%, followers flat. Two very different stories produce that exact chart. In 1 story, a single Reel went far outside the usual audience and lifted the average. In the other, every post did a little better because the content mix changed. On a basic dashboard both look identical, and the right next step for each is opposite.
On CultureX, the Tracking Suite handles this layer for connected Instagram, YouTube, TikTok and Facebook accounts: follower growth, engagement rate, reach and views in 1 view, updated without pulling exports. It answers “what happened” so the team can spend its time on the next 3 questions.
Diagnostic analytics: why it happened
Diagnostic analytics looks underneath the totals. Instead of 1 engagement number, it breaks the period into the pieces that produced it: which posts, which formats, which posting slots, and what people were actually saying.
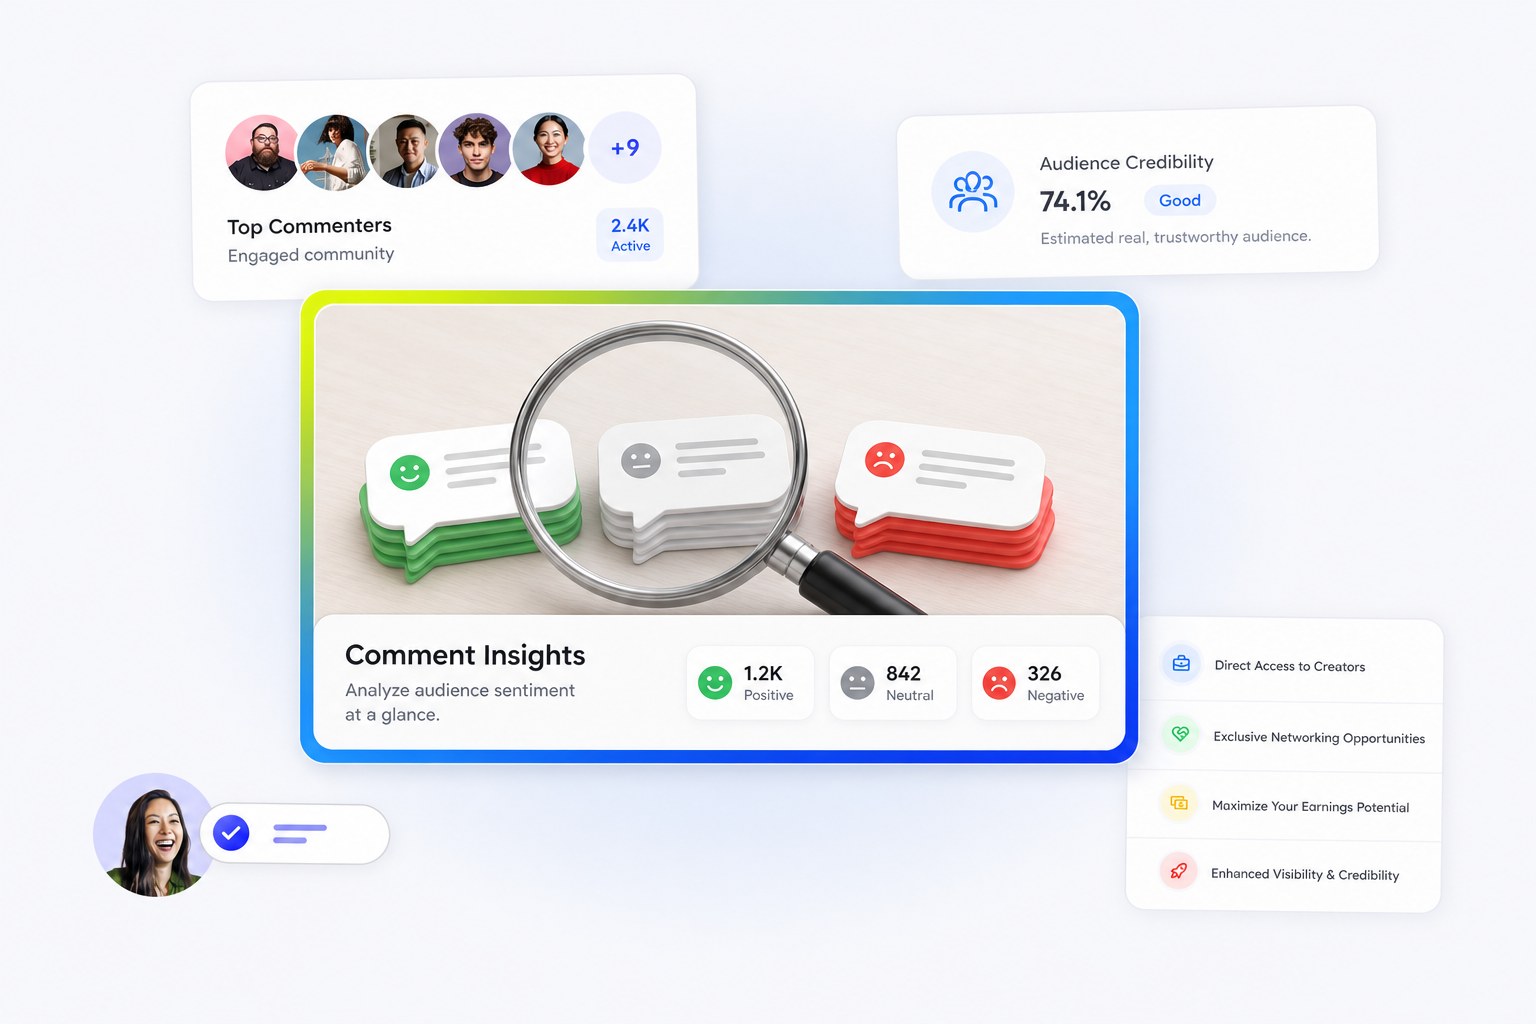
Comments are the fastest diagnosis. Sorted into categories such as purchase intent, product feedback or complaints, they tell you what the audience reacted to. If people are asking where to buy, the content is creating demand. If the thread is about a delivery problem, engagement went up for a reason nobody wants. The number is the same. The meaning is not.
Posting time is the other common cause. Two near-identical posts can land very differently because 1 went out at 9 pm on a Sunday and the other at 11 am on a Tuesday. A heatmap built from your own posting history, rather than a generic “best time to post” rule, shows the slots where your audience is actually active. We cover that in detail in when to post on Instagram.
Back to the 12%. Diagnostic analytics tells you whether it came from 1 post or many, which format drove it, and what the comments say about why. On CultureX this is the diagnosis view in the Tracking Suite: AI labels and themes on your content, positive, negative and neutral sentiment, and comment intent such as purchase intent and product feedback. This is where the Monday meeting stops being guesswork.
Predictive analytics: what might happen next
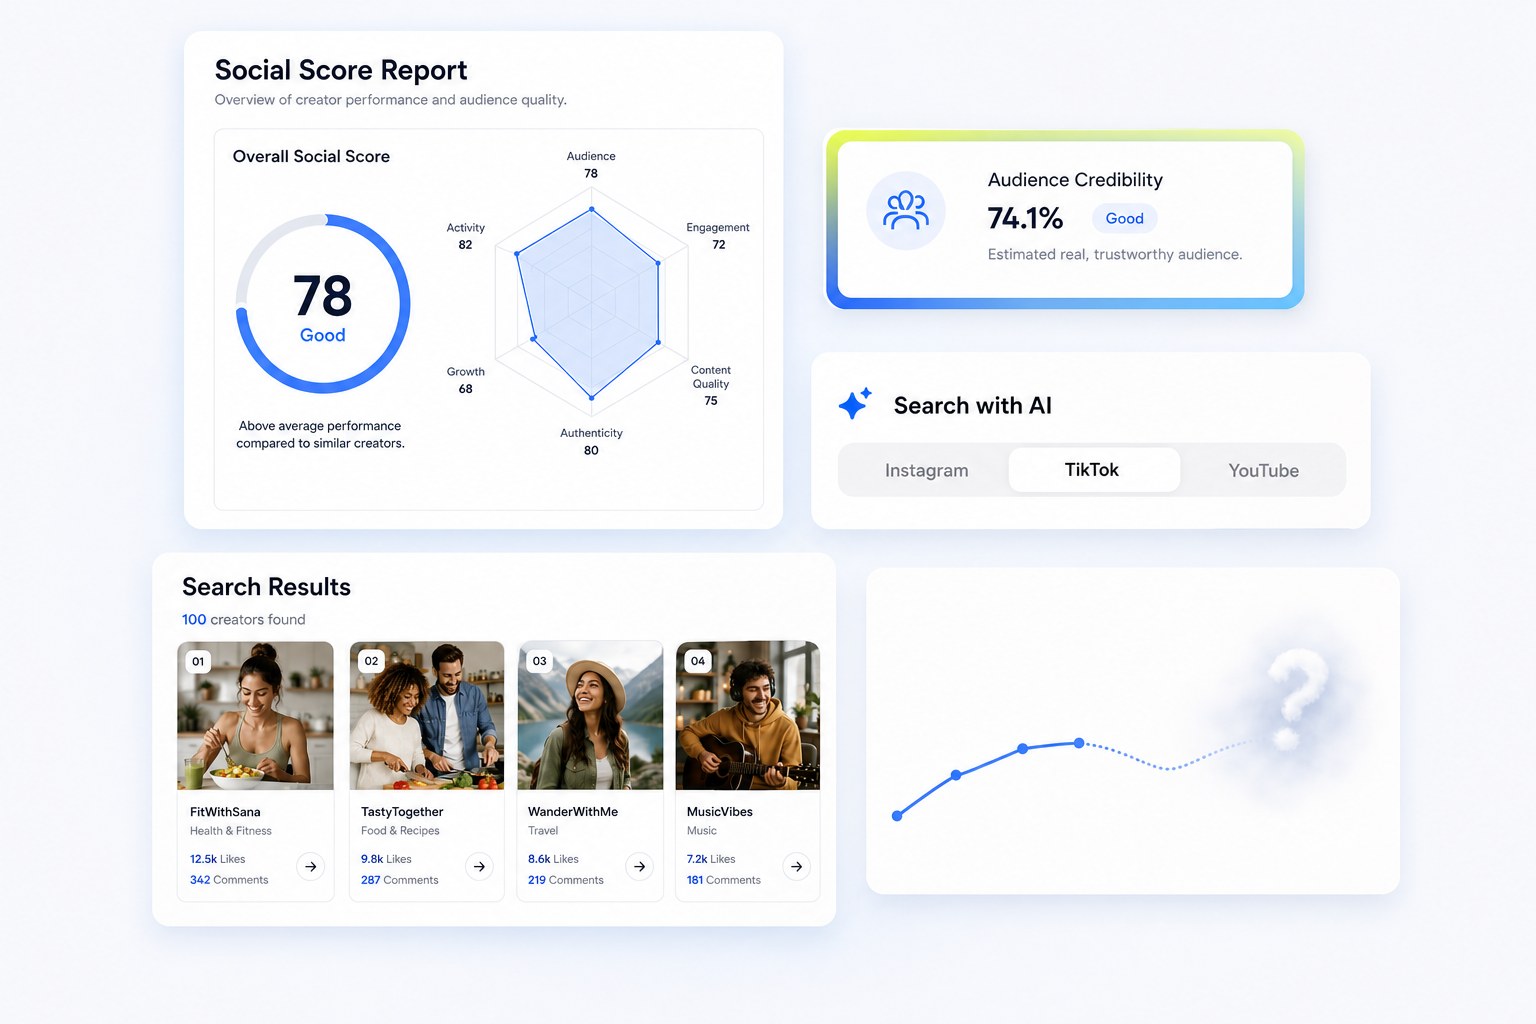
Predictive analytics takes past performance and estimates the future. Expected engagement on the next post, likely follower growth over the next few weeks, how a similar piece of content might perform.
This is the most oversold of the 4. Many platforms mention AI whenever they talk about forecasting, and some of those forecasts are educated guesses on old data dressed up as a model. Social media changes too fast for anyone to predict with confidence. A trend breaks overnight, a competitor launches, an algorithm update ships with no announcement.
So ask for proof. If a vendor says the tool predicts performance, ask to see forecasts it made last quarter next to what actually happened. If they cannot show that, treat the feature as a nice chart.
The more honest version of prediction is benchmarking. Search a creator’s handle or a keyword and look at what content already performs in your niche, then compare average views with median views. Average is inflated by 1 viral post. Median shows what a creator’s content usually does. Looking at both gives a more realistic idea of what to expect than any forecast line.
Prescriptive analytics: what to do about it
Prescriptive analytics goes 1 step past prediction and recommends an action. It sounds like the whole point of analytics, and it is the rarest thing on the market.
The term gets used freely, usually for a dashboard insight with a recommendation bolted on. Good recommendations depend on more than data. They depend on budget, brand tone, business goals and what the team is willing to approve. Most dashboards know none of that.
A more practical version is a question-and-answer layer over your own account history. Ask a plain question, such as which content format drew the most positive sentiment this month, and get an answer built from your own posts rather than from a category average. It does not predict the future or make the decision for you. It gives you a real answer from real data, which is closer to what prescriptive analytics should mean than most of the claims you will read.
Which types does your tool actually deliver?
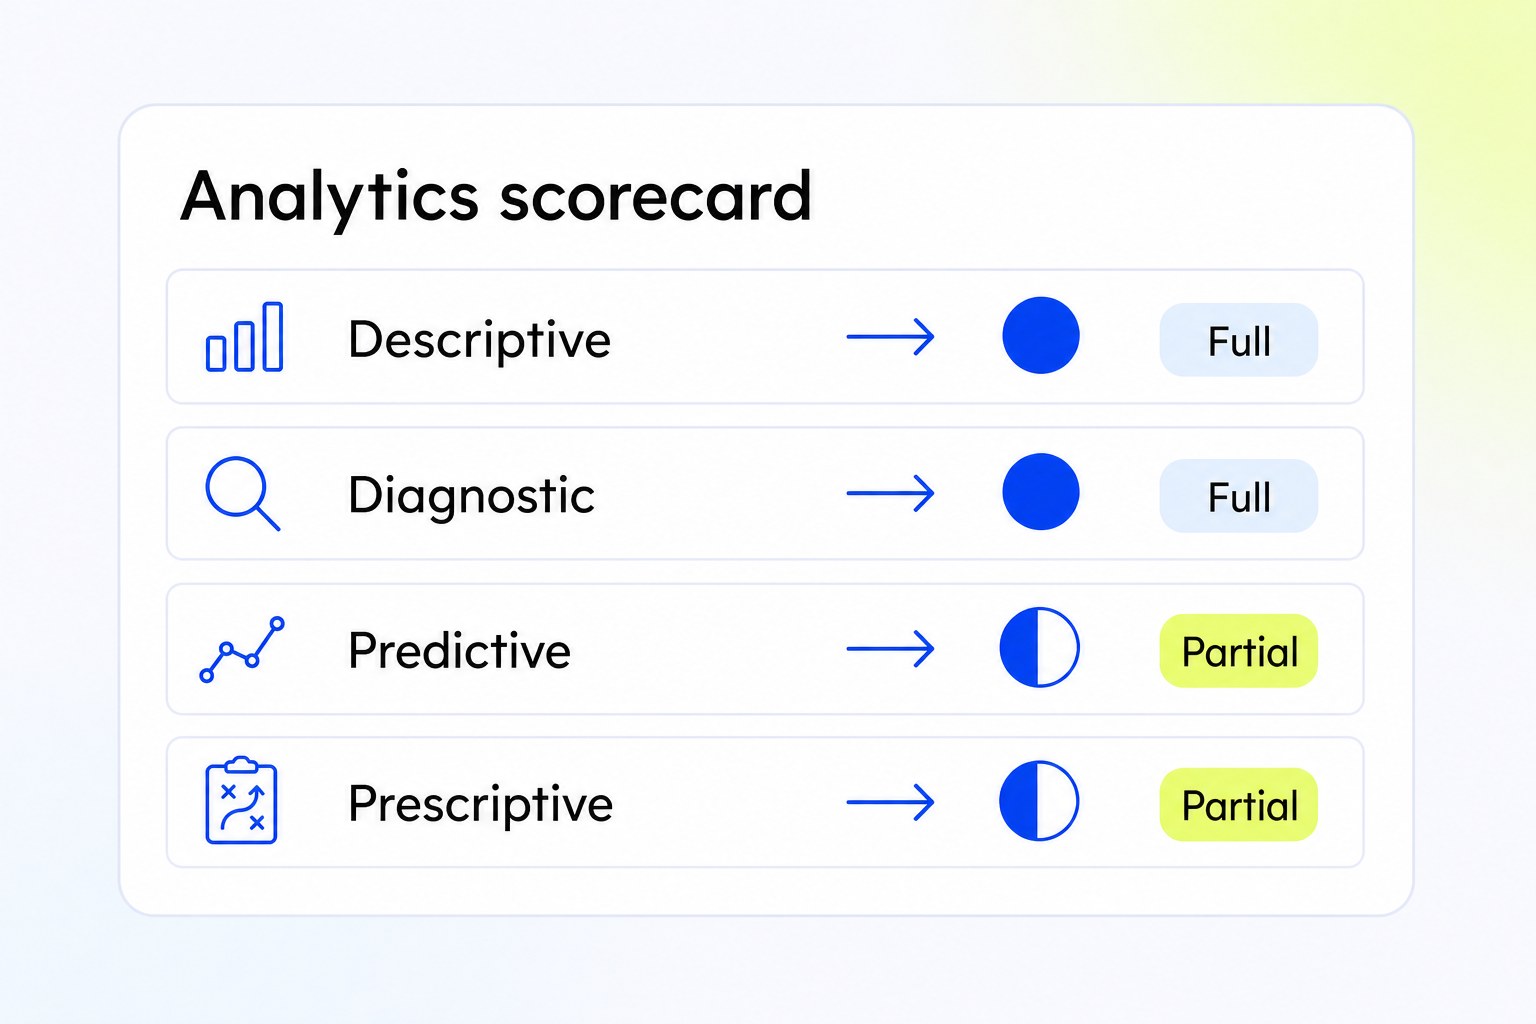
The simplest way to evaluate a tool is to score it against the 4 types on your own account, not a demo brand. Here is how CultureX scores on its own scale, so you can hold other vendors to the same test.
| Type | Question it answers | Covered on CultureX |
|---|---|---|
| Descriptive | What happened? | Yes. Growth, engagement, reach and views across connected accounts. |
| Diagnostic | Why did it happen? | Yes. Posting-time heatmap, content labels, sentiment and comment intent. |
| Predictive | What will happen next? | Partly. Benchmarking against past and category performance. No forecasting claims. |
| Prescriptive | What should we do? | Partly. Ask questions of your own data. Not a full prescriptive engine. |
If your goal is to understand what is happening on your channels and why, the descriptive and diagnostic layers are where the value sits, and they are where most decisions get made. Supertails lifted brand engagement 60% on live monitoring alone, without a forecast in sight.
Turning the 4 types into better decisions
The value of social media analytics is in what you do with it, and the 4 types are a checklist for that. Descriptive tells you the number moved. Diagnostic tells you why. Predictive gives you a sensible range for next month. Prescriptive, where it exists, tells you what to change. When a report covers all 4, the Monday meeting gets shorter and the content plan gets better.
If you are building that report by hand, start with our social media reporting template. If you are buying a platform, read what a social media analytics platform does day to day before the demo. And if competitor benchmarking is the missing piece, that lives in the Listening Suite rather than in your own-account analytics.
See CultureX in action
We will run all 4 types on your own account during the call, so you can see which questions get real answers.
Frequently asked questions
What are the 4 types of social media analytics?
Descriptive (what happened), diagnostic (why it happened), predictive (what might happen next) and prescriptive (what to do about it). Most tools cover the first 2 well and either skip or oversell the last 2, so check which ones a tool actually handles before assuming it covers all 4.
What is the difference between descriptive and diagnostic analytics?
Descriptive analytics shows that engagement rose, reach improved or a post did well. Diagnostic analytics explains why, by looking at content type, posting time and how people reacted in the comments. One reports the result. The other explains it.
Does predictive analytics work for social media?
It is hard to get right. Much of what drives performance sits outside historical data: trends shifting, competitor moves, algorithm changes. Most tools offer a limited version or none, whatever the pricing page says. Ask any vendor for past forecasts next to actual results.
What is prescriptive analytics in social media marketing?
It goes past predicting an outcome to recommending a specific action. True prescriptive analytics is rare in social tools and often oversold when it appears, so ask for a concrete example before taking the claim at face value.
Does CultureX offer predictive social media analytics?
No. CultureX focuses on descriptive analytics (engagement, reach, follower growth) and diagnostic analytics (posting-time heatmap, content labels, sentiment, comment intent). You can ask questions of your own account data, but the platform does not claim to forecast future performance.